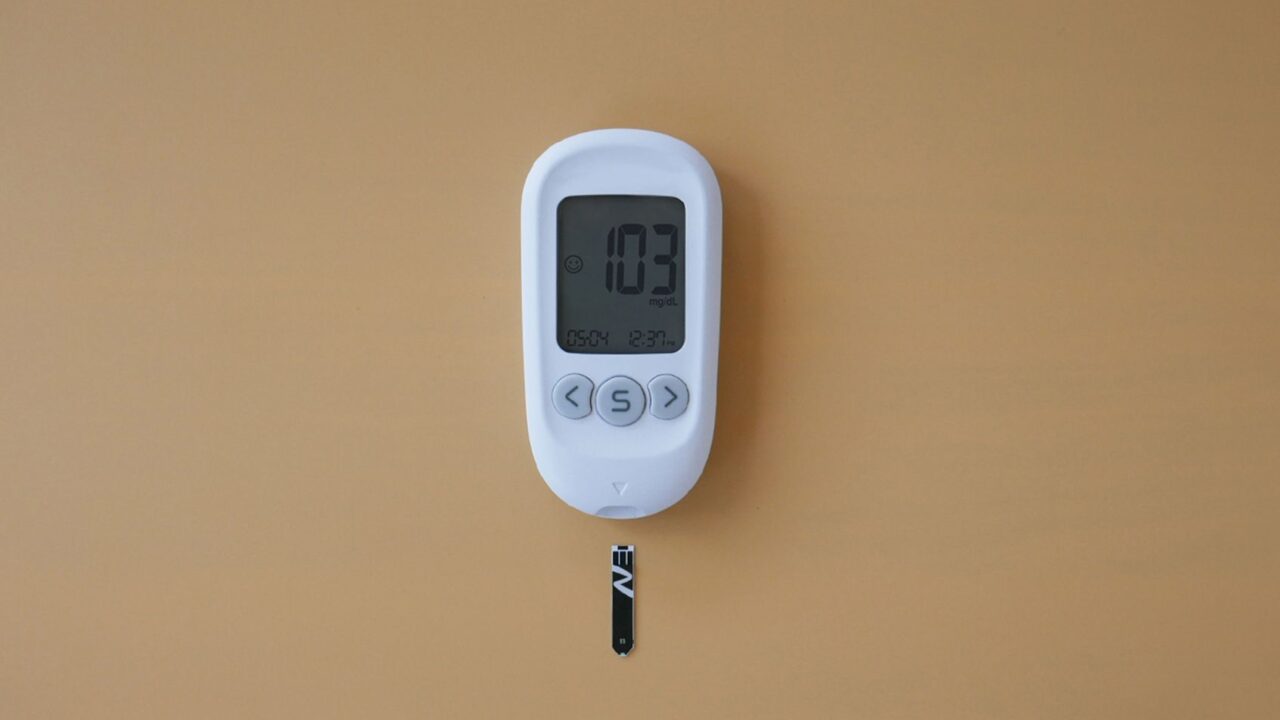
- A high A1C does not chemically change your other blood tests, but the same high blood sugar that raises A1C above 6.5 percent often shows up as worse cholesterol, triglycerides, kidney, and liver results on the same panel.
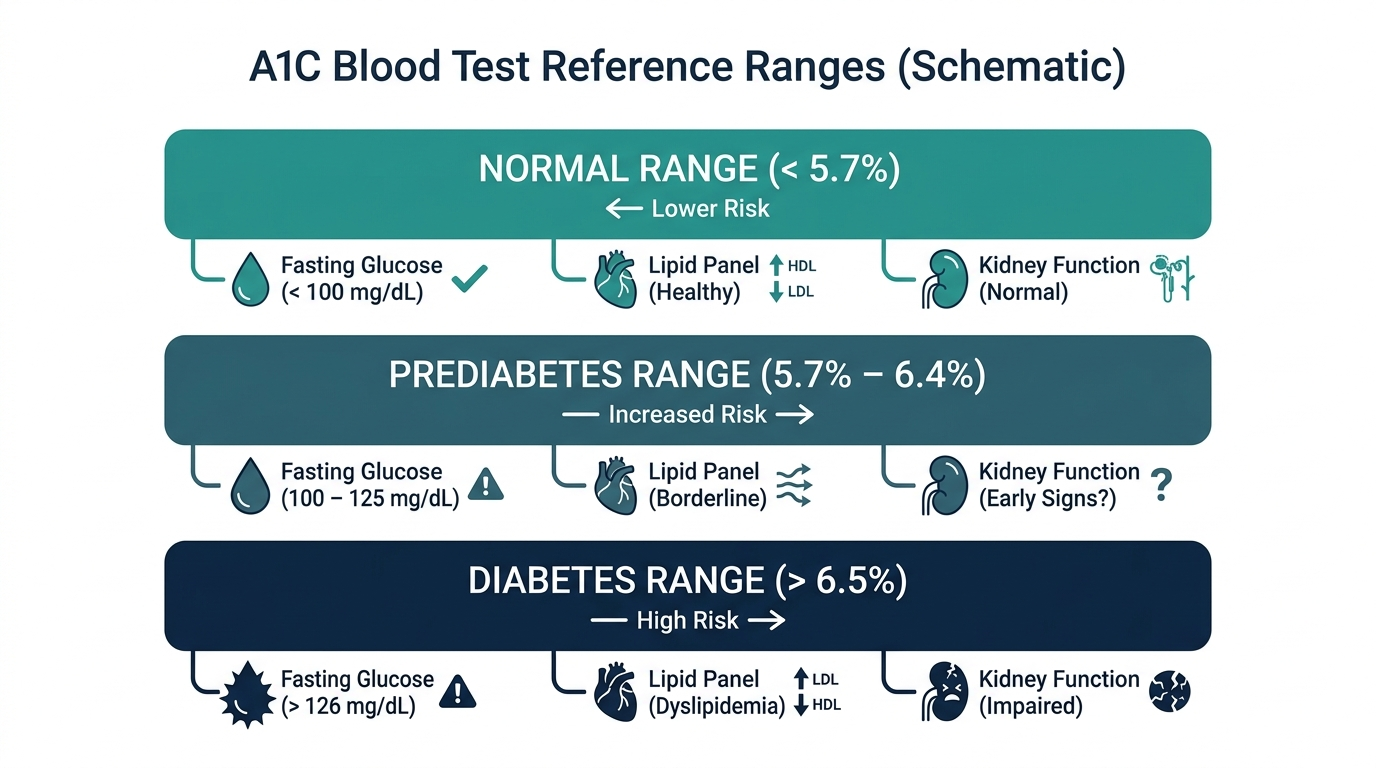
- A1C is reported as a percentage, and an A1C of 6.5 percent or higher meets the American Diabetes Association cutoff for diabetes, while 5.7 to 6.4 percent is prediabetes.
- The bigger lab issue runs the other way: anemia, kidney disease, and hemoglobin variants can make your A1C number falsely high or low, so a single A1C should never be read in isolation.
If you just saw a high A1C on your report and noticed your cholesterol, kidney, or liver numbers also looked off, you are asking a smart question. The short version: A1C does not “spill over” and corrupt the chemistry of other tests, but high blood sugar and the conditions behind it tend to drag several lab values in the same direction at once. Below is how a clinician reads these connections.
What does a high A1C mean, and what is the cutoff?
A high A1C means your average blood sugar over the past 2 to 3 months has been elevated. The American Diabetes Association sets the cutoffs at 5.7 to 6.4 percent for prediabetes and 6.5 percent or higher for diabetes, with anything under 5.7 percent considered normal (American Diabetes Association). A1C measures the share of your hemoglobin coated in sugar, so it reflects a months-long pattern, not one meal.
To picture it, labs convert A1C into estimated average glucose using eAG = 28.7 × A1C − 46.7. An A1C of 7 percent equals roughly 154 mg/dL average glucose, and 9 percent equals about 212 mg/dL (Cleveland Clinic). That number is what stresses your blood vessels, kidneys, and liver over time, which is the real reason other results move.
What causes a high A1C to travel with other abnormal results?
A high A1C travels with other abnormal results because chronic high glucose damages multiple organs at the same time, not because one test alters another. People with diabetes carry a higher risk of high LDL cholesterol and high triglycerides, both of which raise cardiovascular risk (American Diabetes Association).
Here is how the pieces line up on a typical comprehensive panel:
- Lipids: Insulin resistance, the engine behind most high A1C readings, pushes triglycerides up and HDL down, so a high A1C and a poor lipid panel often arrive together.
- Kidney (eGFR, urine albumin): Studies show an inverse relationship, meaning as average A1C rises, mean eGFR falls across early chronic kidney disease stages (diaTribe).
- Liver (ALT, AST): In type 2 diabetes, elevated ALT and AST can flag fatty liver tissue, which clusters with high blood sugar (Clinica Chimica Acta).
So the pattern is shared cause, not contamination. The high sugar is the common thread.
Can other conditions make the A1C itself wrong?
Yes, and this is the more important lab trap. Several common conditions distort the A1C number without your sugar actually being that high or low. The National Institute of Diabetes and Digestive and Kidney Diseases notes that clinicians should suspect interference when your A1C and your direct blood glucose readings do not match (NIDDK).
- Iron deficiency anemia: Can falsely raise A1C, making your control look worse than it is.
- Hemolytic anemia and recent blood loss: Shorten red cell lifespan and can falsely lower A1C.
- Chronic kidney disease: Through anemia and altered red cell production, can shift A1C either way (diaTribe).
- Hemoglobin variants: Common in people of African, Mediterranean, or Southeast Asian descent, these can falsely raise or lower A1C depending on the assay (NIDDK).
Are there symptoms, or is a high A1C silent?
A high A1C is usually silent in the prediabetes range and in early diabetes, which is exactly why it gets caught on routine blood work rather than because of symptoms. Many people with an A1C between 5.7 and 6.4 percent feel completely normal (NIDDK).
As average glucose climbs higher, classic warning signs can appear: increased thirst, frequent urination, fatigue, blurred vision, slow healing cuts, and unexplained weight changes. The danger is that by the time symptoms show, glucose may have been quietly harming kidneys and vessels for years. This is the practical case for not waiting on symptoms and instead acting on the number itself.

When is a high A1C dangerous?
A high A1C becomes more dangerous the higher it climbs and the longer it stays elevated. Within the prediabetes range of 5.7 to 6.4 percent, the higher the value, the greater the risk of progressing to diabetes (American Diabetes Association). Most people with diabetes are advised to aim for an A1C under 7 percent to lower complication risk (MedlinePlus).
Seek prompt care if a very high A1C comes with symptoms like extreme thirst, confusion, rapid breathing, or vomiting, which can signal acutely dangerous glucose levels. A high A1C paired with falling eGFR, rising urine albumin, or worsening liver enzymes is also a signal that organ damage may already be underway and needs faster action.
What should you do next?
Your next step is to look at the high A1C alongside the rest of the panel rather than in isolation, then confirm and act with your clinician. A single A1C of 6.5 percent or higher is usually repeated or paired with a fasting glucose to confirm a diabetes diagnosis (American Diabetes Association).
- Ask about interference: If you have anemia, kidney disease, or a hemoglobin variant, ask whether a fasting glucose, oral glucose tolerance test, or fructosamine would be more reliable.
- Review the whole picture: Pair A1C with lipids, eGFR, urine albumin, and liver enzymes to see the full metabolic story.
- See a doctor if your A1C is 5.7 percent or higher, if your A1C and home glucose readings clash, or if other labs are drifting at the same time.
Insider nuance: the number is only as good as your red blood cells
Here is the nuance many people miss: A1C is not a direct glucose measurement, it is a measurement of how long sugar has been stuck to your red blood cells, so anything that changes red cell lifespan changes the result. That is why two people with identical average sugar can post different A1C values.
In practice, when an A1C looks surprisingly high or low and does not match how someone feels or what their glucometer shows, an experienced clinician checks a complete blood count for hidden anemia before changing any treatment. Treating a falsely high A1C as if it were real can lead to over-medication and dangerous low blood sugar. The lesson: a high A1C is a starting question, not a final verdict, and the other tests on the page often hold the answer.

A1C to average glucose: the conversion at a glance
Because A1C is a percentage and home glucose meters read in mg/dL, it helps to translate between the two. Labs use the equation eAG = 28.7 times A1C minus 46.7 to turn an A1C into an estimated average glucose (MedlinePlus). Seeing the two side by side makes the meaning of a number concrete:
| A1C | Estimated average glucose | Category |
|---|---|---|
| 5.0% | About 97 mg/dL | Normal |
| 5.7% | About 117 mg/dL | Prediabetes begins |
| 6.5% | About 140 mg/dL | Diabetes threshold |
| 7.0% | About 154 mg/dL | Common treatment target |
| 9.0% | About 212 mg/dL | Markedly elevated |
This is also why A1C and a single glucometer reading can look different: the meter shows one moment, while A1C reflects the average across roughly the prior three months. A big gap between what your A1C predicts and what your meter shows is itself a clue that something, often a red cell issue, is skewing the A1C.
What glycation actually is, and why three months
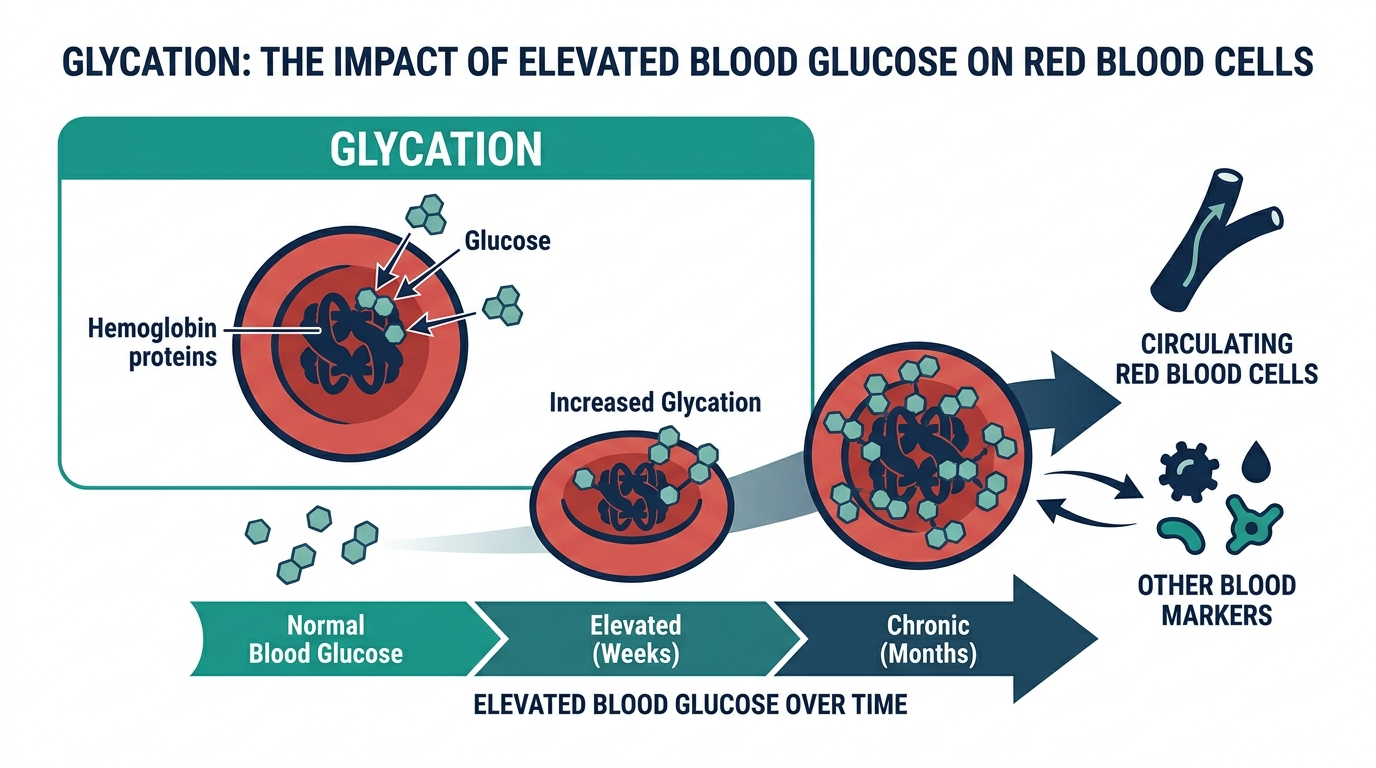
The chemistry behind A1C explains most of its quirks. Glucose in your bloodstream slowly and irreversibly attaches to hemoglobin, the oxygen-carrying protein inside red blood cells, in a process called glycation. The more glucose that is around, the larger the fraction of hemoglobin that ends up sugar-coated, which is what A1C measures. Because glycation is essentially permanent for the life of the cell, the A1C of any given red cell reflects the glucose it has been bathed in since it was made.
Red blood cells live about 120 days on average, so at any moment your blood holds a mix of young and old cells carrying a running record of your glucose exposure. That is why A1C represents roughly a 2 to 3 month average, weighted a little toward the most recent weeks since newer cells outnumber the oldest. It also explains the central vulnerability: anything that changes how long red cells live changes the A1C, independent of your actual sugar. Shorter-lived cells (as in hemolysis or recent bleeding) spend less time getting glycated and can lower A1C, while conditions that lengthen red cell survival or slow turnover can raise it.
A1C versus the other ways to measure blood sugar
When A1C is unreliable, or when a diagnosis needs confirming, clinicians turn to other glucose tests. Each measures a different window of time, which is exactly why they complement one another:
| Test | What it captures | Best used when |
|---|---|---|
| A1C | Average glucose over 2 to 3 months | Screening, diagnosis, long-term monitoring |
| Fasting glucose | Blood sugar after an overnight fast | Quick snapshot, confirming a diagnosis |
| Oral glucose tolerance test | How you handle a measured sugar load over 2 hours | Pregnancy, or when A1C and fasting glucose disagree |
| Fructosamine | Average glucose over about 2 to 3 weeks | When A1C is unreliable due to red cell or hemoglobin issues |
Fructosamine is the underused option worth knowing. It measures sugar bound to blood proteins rather than to hemoglobin, so it sidesteps the red cell lifespan problem entirely. In someone with anemia, a hemoglobin variant, or kidney disease that makes A1C untrustworthy, fructosamine gives a shorter but cleaner read on recent control.
The metabolic cluster: why these markers travel together
A high A1C rarely arrives alone because insulin resistance, the underlying engine, disturbs several systems at once. This is the basis of what clinicians call metabolic syndrome, a cluster that tends to appear as a group on the same panel. Reading them together tells a fuller story than any single line:
- Triglycerides high, HDL low. Insulin resistance drives this classic lipid pattern, so a poor triglyceride and HDL picture often shadows a high A1C.
- Rising blood pressure. Not a blood test, but frequently recorded alongside, and part of the same syndrome.
- Waist circumference and fatty liver. Elevated ALT and AST can reflect fat accumulating in the liver, which clusters tightly with high blood sugar.
- Kidney markers drifting. A falling eGFR or rising urine albumin can signal that sustained high glucose is beginning to stress the kidneys.
The practical takeaway is that treating a high A1C is rarely just about the sugar number. The same lifestyle and, when needed, medical changes that improve A1C often move the whole cluster in the right direction, which is why clinicians look at the panel as a system rather than a stack of isolated results.
How often to test, and who should
Testing frequency depends on where you stand. For adults at average risk with a normal result, A1C is commonly checked every 3 years as part of routine screening, often starting in mid-adulthood or earlier with risk factors. In the prediabetes range, yearly testing is typical to catch progression. For someone diagnosed with diabetes, A1C is usually checked about every 3 months when treatment is changing or control is off target, and roughly twice a year once stable and at goal. The 3 month rhythm is not arbitrary, it matches the red cell lifespan, so testing much sooner rarely shows a true change.
Higher-risk groups deserve closer attention: people with a family history of diabetes, those carrying extra weight around the middle, people with high blood pressure or an abnormal lipid panel, those with a history of gestational diabetes, and members of higher-risk ethnic groups. If you fall into more than one of these, the case for regular A1C testing, read alongside the rest of your metabolic panel, is strong.
Do you need to prepare, and what can skew the reading
One convenience of A1C is that it does not require fasting, so it can be drawn at any time of day regardless of your last meal. That is a real advantage over fasting glucose and part of why A1C is such a practical screening tool. That said, if your clinician is ordering A1C alongside a fasting glucose or a lipid panel on the same visit, you may still be asked to fast for those companion tests, so follow the instructions you are given.
Beyond red cell lifespan, a few other factors can nudge an A1C result. Recent significant blood loss or a blood transfusion mixes in cells with a different glycation history and can distort the number for weeks. Pregnancy shifts red cell turnover, which is one reason the oral glucose tolerance test, not A1C, is preferred for diagnosing gestational diabetes. Some supplements taken in very high doses, along with certain assays and hemoglobin variants, can interfere with specific testing methods. The single most useful habit is consistency: using the same laboratory over time reduces method-to-method variation, so a change in your A1C is more likely to reflect a real change in your glucose rather than a difference in how it was measured.
Common misconceptions about A1C and your other labs
- “A high A1C directly damaged my other test results.” No. A1C does not contaminate other tests. Shared high glucose and insulin resistance move several markers together, which is correlation through a common cause.
- “A1C is a direct blood sugar measurement.” It is not. It measures glycated hemoglobin, an indirect record shaped by both glucose and red cell lifespan.
- “A normal A1C rules out any sugar problem.” Not always. Conditions that shorten red cell life can mask elevated glucose, which is why a fasting glucose or OGTT sometimes reveals what a normal-looking A1C hides.
- “One high A1C means I have diabetes for certain.” A diagnosis usually needs confirmation, either a repeat A1C or a second test like fasting glucose, especially if interference is possible.
- “If my A1C is high, I just need to eat less sugar today.” A1C reflects months, not a day. Sustainable changes over weeks, not a single low-carb meal before the draw, are what move it.
What happens to the rest of the panel when A1C improves
If a high A1C tends to drag other markers down with it, the encouraging corollary is that improving blood sugar often lifts the whole cluster back up, because you are addressing the shared cause rather than each number one at a time. This is one of the most motivating things to understand about a metabolic panel: the same effort pays off in several columns at once.
- Triglycerides and HDL. Because insulin resistance drives high triglycerides and low HDL, the lifestyle and medical changes that improve A1C frequently pull triglycerides down and nudge HDL up, often noticeably, as glucose control gets better.
- Liver enzymes. When fatty liver is part of the picture, weight loss and better glucose handling can lower an elevated ALT toward normal over time, since you are reducing the fat stressing the liver.
- Kidney markers. Slowing the glucose damage that stresses the kidneys can help stabilize eGFR and urine albumin, which is a central reason clinicians push to bring a high A1C down.
The timeline is the key expectation to set. Because A1C reflects red cell lifespan, a genuine change in it takes weeks to months to appear, so a follow-up A1C is usually spaced about three months out rather than checked in days. Lipids and liver enzymes can move on their own timelines. The practical mindset is patience and consistency: sustained changes move the whole panel in the same favorable direction, but the numbers report back on the body’s schedule, not the calendar you might wish for.
A1C versus continuous glucose monitoring and time in range
A1C has long been the anchor of glucose assessment, but it is increasingly read alongside newer tools, and understanding the relationship helps you make sense of what each one is telling you. The most important newcomer is continuous glucose monitoring, where a small sensor tracks glucose around the clock and reports how much of the time you spend within a target range.
The reason this matters is that A1C is an average, and averages hide swings. Two people can share the same A1C while one has steady, gentle glucose levels and the other lurches between highs and lows that cancel out on paper. Time in range captures that difference, showing not just the average but the stability behind it, which is information A1C alone cannot provide.
None of this retires A1C. It remains the standard for diagnosis and long-term monitoring, it is cheap and widely available, and it needs no wearable device. But for someone whose A1C is hard to interpret, because of anemia, a hemoglobin variant, or kidney disease, or for someone working to smooth out glucose swings, pairing A1C with a shorter-window measure or with time-in-range data gives a fuller, more actionable picture than the single percentage ever could on its own.
Frequently asked questions
Does a high A1C raise my cholesterol numbers directly?
No. A high A1C does not chemically raise cholesterol. The insulin resistance behind a high A1C independently pushes triglycerides up and HDL down, so both show up abnormal on the same panel because of a shared cause, not because A1C alters the cholesterol test.
Can anemia make my A1C falsely high?
Yes. Iron deficiency anemia can falsely elevate A1C, making your blood sugar control look worse than it truly is, according to the NIDDK. If you have anemia, ask whether a fasting glucose or glucose tolerance test would give a more accurate picture.
What A1C level counts as diabetes?
An A1C of 6.5 percent or higher meets the American Diabetes Association cutoff for diabetes. A range of 5.7 to 6.4 percent is prediabetes, and under 5.7 percent is normal. A diabetes diagnosis is usually confirmed with a repeat or additional test.
Does high blood sugar affect kidney test results?
Yes, over time. Sustained high blood sugar damages the kidneys, and research shows mean eGFR falls as average A1C rises across early kidney disease stages. A high A1C with a low eGFR or high urine albumin suggests diabetic kidney involvement worth prompt evaluation.
Should I repeat an A1C if it seems wrong?
Yes. If your A1C does not match your home glucose readings or how you feel, ask your clinician to repeat it and check for anemia or a hemoglobin variant. A fasting glucose or glucose tolerance test can confirm whether the A1C is accurate.
Sources
- American Diabetes Association, Understanding A1C
- American Diabetes Association, Diabetes Diagnosis and Tests
- American Diabetes Association, Key Medical Screenings for Diabetes
- Cleveland Clinic, A1C: What It Is, Test, Levels and Chart
- NIDDK, The A1C Test and Diabetes
- NIDDK, Interpreting A1C: Diabetes and Hemoglobin Variants
- MedlinePlus, Estimated Average Glucose (eAG)
- diaTribe, Get to Know Your Lab Tests: A1C, eGFR, UACR and More
- diaTribe, Your A1C May Not Be Reliable If You Have Chronic Kidney Disease
- Clinica Chimica Acta, Association Between Liver and Chronic Kidney Disease on Hemoglobin A1c Concentrations
This article is for general educational purposes and is not medical advice. It cannot diagnose or treat you and does not replace your clinician. Always discuss your lab results and any health decisions with a qualified healthcare professional.
Related: find the right at-home biomarker test.
Vital Signs Today may earn a commission if you buy through links on this page. It does not affect our editorial assessments.