
You got your lab results back, and tucked in among the cholesterol and the blood counts is a line that says A1C with a percentage next to it. Maybe it read 5.9, maybe 6.2, and unlike a glucose reading it does not match any number you have ever seen on a finger stick. So what is this percentage actually telling you, and why does your doctor seem to care about it more than almost anything else on the page?
Here is the short version. The A1C is the closest thing medicine has to a report card for your blood sugar, and it covers the last few months, not the last few hours. That single feature is what makes it powerful, and also what makes it easy to misread.
What an A1C blood test is, in plain English
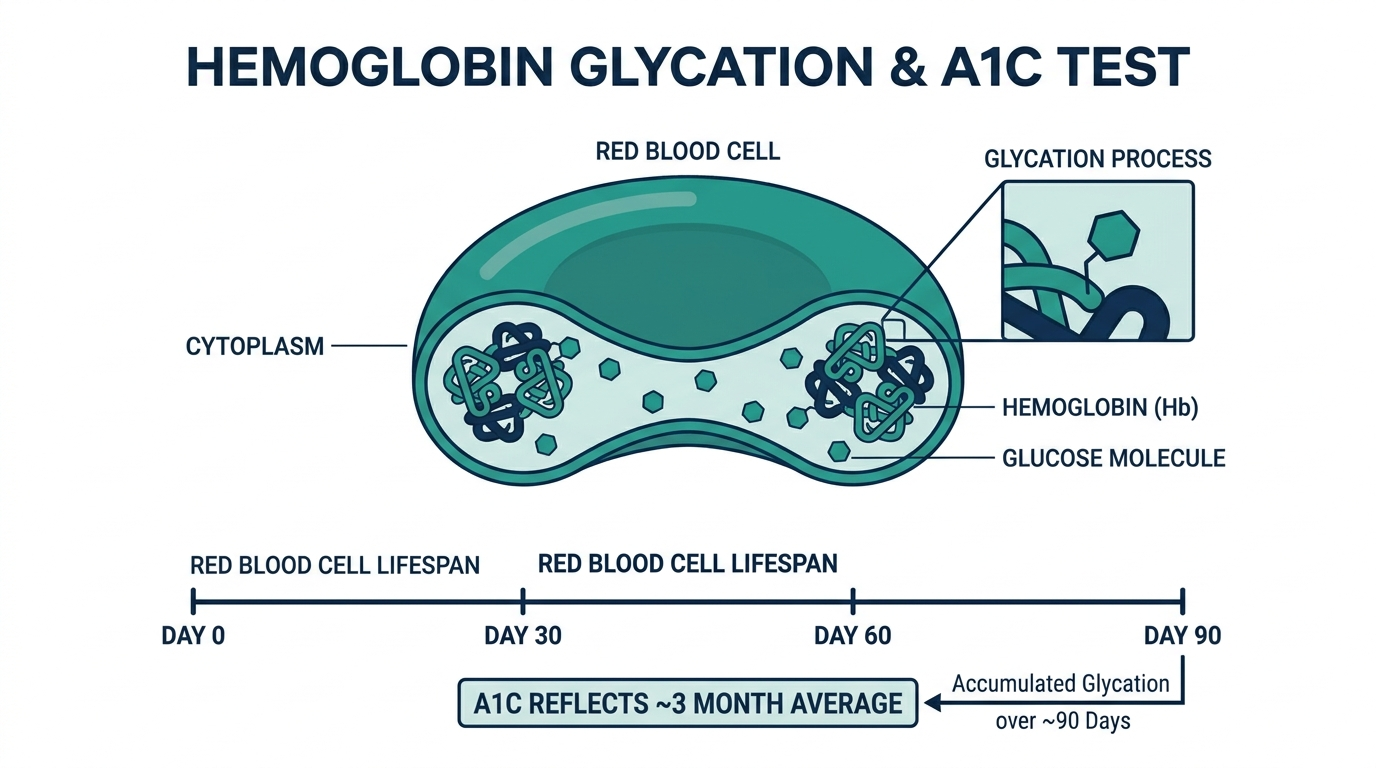
An A1C blood test measures the percentage of your red blood cells that carry glucose-coated hemoglobin, which works out to your average blood sugar over the past two to three months (MedlinePlus). Glucose in your bloodstream sticks to hemoglobin, the protein inside red blood cells that carries oxygen. The more sugar floating in your blood, the more of it sticks. The A1C result is simply the share of your hemoglobin that has sugar attached to it, written as a percentage.
Because red blood cells live for about three months, that sugar coating builds up over their whole lifespan, so one A1C reading captures a long-running average rather than a single moment (MedlinePlus). A finger stick tells you what your sugar is doing right now. An A1C tells you what it has been doing for months. That is why you do not need to fast for it and why a donut on the way to the lab will not wreck the result.
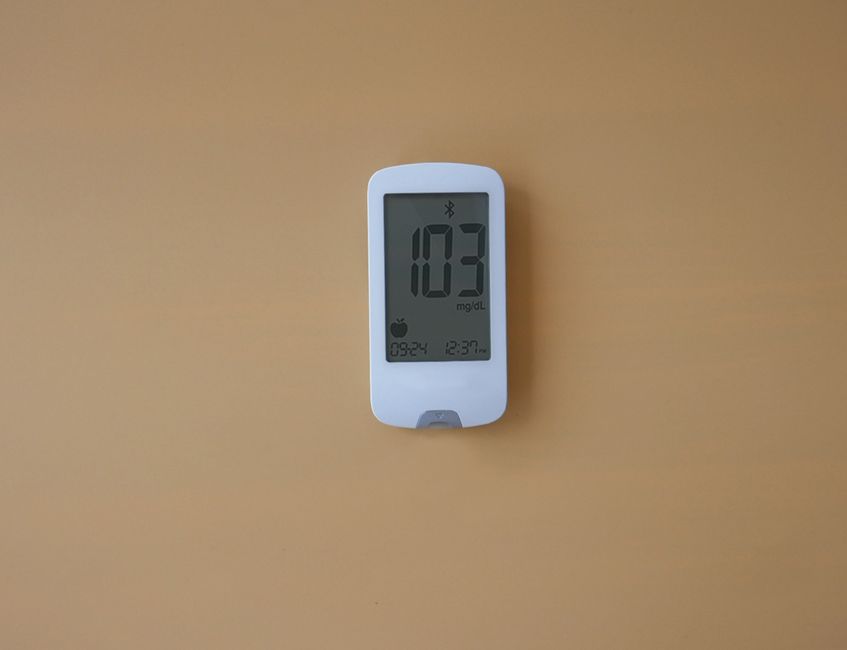
What is A1C on a blood test report, and where do you find it?
On a blood test report, A1C usually appears in its own short section or under a metabolic or diabetes panel, listed as a single percentage with a reference range beside it. It is not part of the complete blood count, so do not go hunting for it among your red and white cell numbers. Look instead for a line labeled A1C, HbA1c, or hemoglobin A1c.
The abbreviation trips a lot of people up. A1C, HbA1c, and HbA1C all mean the same test. The Hb stands for hemoglobin, and the A1c refers to the specific subtype of hemoglobin that glucose binds to. You may also see it written as glycohemoglobin, glycated hemoglobin, or glycosylated hemoglobin, which are all the same thing (MedlinePlus). Some labs also print an eAG, or estimated average glucose, next to the percentage, which we will get to below.
What is a normal A1C level?
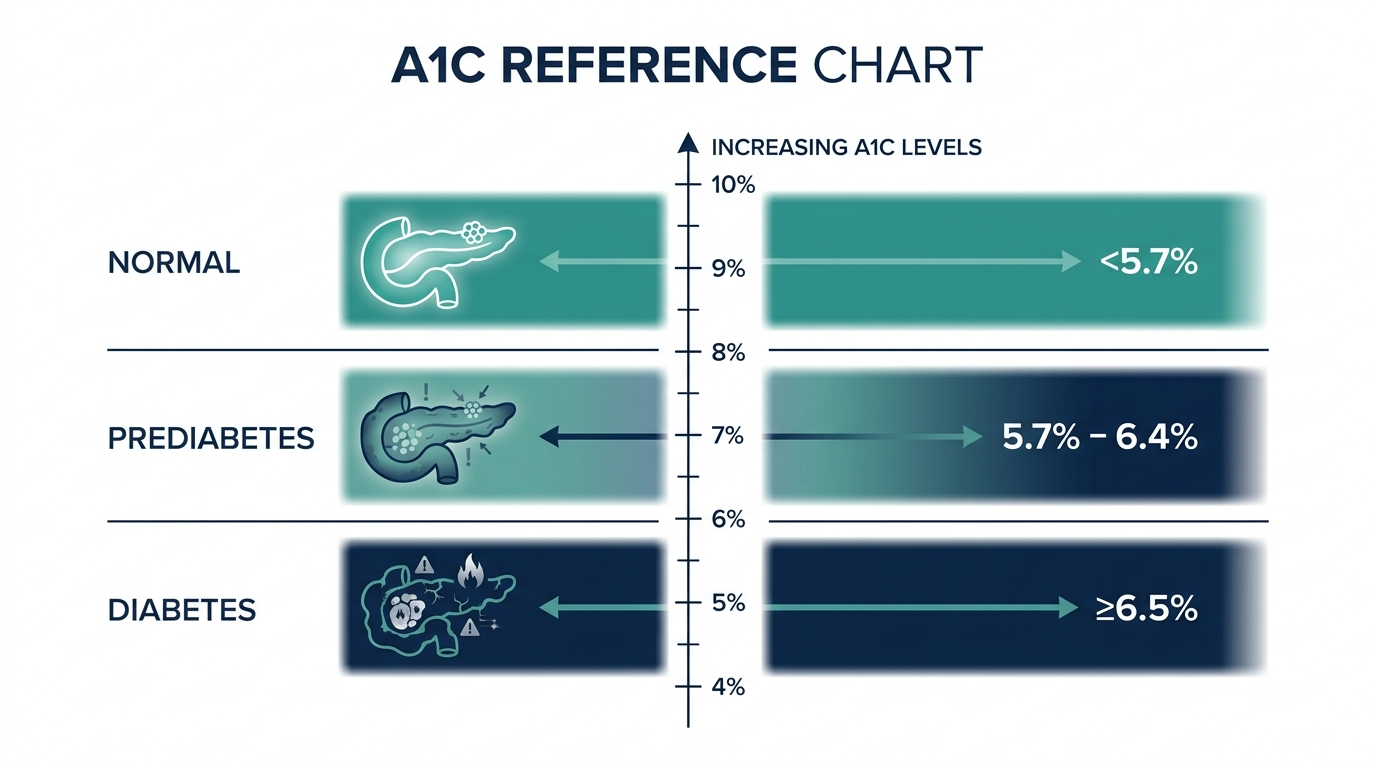
A normal A1C is below 5.7 percent. From there the cutoffs are clean and widely agreed on: 5.7 to 6.4 percent falls in the prediabetes range, and 6.5 percent or higher on two separate tests is used to diagnose diabetes (Cleveland Clinic). These same thresholds are echoed by federal guidance (NIDDK).
- Below 5.7 percent: no diabetes, considered normal.
- 5.7 to 6.4 percent: prediabetes.
- 6.5 percent or higher: diabetes, when confirmed on a repeat test.
Prediabetes is not a harmless gray zone. People with prediabetes have a high chance of developing type 2 diabetes within 5 to 10 years (NIDDK). The upside is that an A1C in the 5.7 to 6.4 range is also the easiest point to turn things around, often with weight, diet, and movement alone, before the number crosses into diabetes territory.
If you already have diabetes, the goal shifts from diagnosis to control. For most adults with diabetes, the American Diabetes Association recommends keeping A1C at or below 7 percent, because holding it there lowers the long-term risk of complications, though the exact target is individualized and can be set higher for older adults or those with a history of severe low blood sugar (NIDDK).
What does a high A1C mean?
A high A1C means your average blood sugar has been running elevated for months, which is the central sign of prediabetes or diabetes depending on how high it climbs (Cleveland Clinic). The higher the percentage, the more glucose has been coating your hemoglobin, and the harder your body has been working to clear sugar from the blood.
This matters because chronically high blood sugar quietly damages small blood vessels and nerves over time. That is the pathway to the familiar complications of diabetes, including eye, kidney, and nerve problems. A single high reading is not a catastrophe, but it is a signal that the trend over the last quarter has been in the wrong direction, and it is usually confirmed with a second test before any diagnosis is made (NIDDK).
What does a low A1C mean?
A low A1C, meaning a result comfortably in the normal range below 5.7 percent, is generally good news and indicates your average blood sugar has been well controlled. For someone without diabetes, a low-normal A1C is exactly what you want to see.
There is a nuance for people who are actively treating diabetes. An A1C that is unexpectedly low, especially well under target, can sometimes reflect frequent episodes of low blood sugar, or it can be skewed by conditions that shorten the life of red blood cells. In healthy people a genuinely low A1C is not a disease and nothing to chase. In people on glucose-lowering medication, a surprisingly low number is worth a conversation with the prescriber rather than a quiet celebration.
How does A1C show up next to estimated average glucose?
Many labs now print an estimated average glucose, or eAG, right beside your A1C, and the two describe the same thing in different units. The A1C is a percentage, while the eAG is converted into milligrams per deciliter, the same units as a home glucose meter, so the average is easier to picture (MedlinePlus). Roughly speaking, an A1C in the normal 4 to 6 percent band corresponds to an eAG of about 70 to 126 mg/dL, and an A1C under 7 percent maps to an eAG below 154 mg/dL (MedlinePlus).
One honest caveat that the source itself stresses: eAG is only an estimate, and the real spread of daily blood sugars behind any single A1C value is very wide (MedlinePlus). Two people with an identical 7 percent A1C can live very different days, one steady and one bouncing between highs and lows that happen to average out. The A1C captures the average, not the swings, which is why people who manage diabetes closely pair it with day-to-day glucose monitoring.
The part most people never hear: a normal A1C is not always trustworthy
Here is the insight that rarely makes it into the patient leaflet. The A1C assumes your red blood cells are living a normal lifespan of about three months, and when that assumption breaks, the number lies. This is the single most important thing to understand about the test, and it explains why a clinician will sometimes ignore an A1C that looks perfectly fine.
Anything that changes how long your red cells survive will distort the result. Conditions that shorten red cell lifespan, including sickle cell anemia, other hemolytic anemias, pregnancy, recent blood transfusion, and chronic kidney failure, can push your A1C falsely low (Cleveland Clinic). Conditions that let cells live longer or change the chemistry, such as iron-deficiency anemia and vitamin B12 deficiency, can push it falsely high (Cleveland Clinic).
There is also an ancestry angle that gets too little airtime. People of African, Mediterranean, or Southeast Asian descent more often carry hemoglobin variants that can throw off certain A1C assays, which is why some results need a different testing method or a fallback to direct glucose measurement (NIDDK). The practical takeaway is this: if you have anemia, a hemoglobin trait, kidney disease, or you are pregnant, do not take a normal A1C at face value. Ask whether a fasting glucose or an oral glucose tolerance test would tell a truer story. The cheapest mistake in this whole area is trusting a single A1C in a body where the test was never going to be accurate.

How often should you get an A1C tested?
The right interval depends entirely on which side of the line you sit on, and matching the frequency to your situation is how the number becomes useful rather than just reassuring.
- No diabetes, normal A1C: Screening is typically folded into routine checkups. Standard adult screening for type 2 diabetes generally begins around age 35 and repeats every few years if results are normal, sooner if you carry risk factors like obesity, family history, or high blood pressure.
- Prediabetes: The American Diabetes Association recommends monitoring at least once a year to catch the shift toward diabetes early, with more frequent checks if you have several risk factors (American Diabetes Association).
- Diabetes, at goal and stable: At least twice a year, roughly every six months, is the usual cadence when your numbers are steady and you are meeting your target (American Diabetes Association).
- Diabetes, above goal or recently changed treatment: Every three months, because that interval matches roughly how long it takes a medication or lifestyle change to fully show up in the A1C (American Diabetes Association).
Notice why three months is the tightest sensible interval. Since the A1C reflects the previous two to three months of red cell life, testing more often than that mostly re-measures the same window and rarely tells you anything new. If a doctor orders an A1C only six weeks after the last one, it is usually to catch a large, fast change, not to track fine progress.
A1C versus fasting glucose versus the tolerance test
The A1C is not the only way to diagnose or monitor blood sugar, and understanding how it compares to the alternatives explains why your doctor sometimes orders more than one.
| Test | What it captures | Fasting needed | Best for |
|---|---|---|---|
| A1C | Average over two to three months | No | The big-picture trend, convenience, no prep |
| Fasting plasma glucose | Your level after an overnight fast | Yes | A single-moment snapshot, useful when A1C is unreliable |
| Oral glucose tolerance test | How your body handles a sugar drink over two hours | Yes | Catching early problems A1C and fasting glucose can miss, and pregnancy screening |
Each test sees a different slice of the same reality. The A1C is the most convenient because it needs no fasting and is unfazed by a recent meal, which is exactly why it became so popular. But it is an average, and averages hide the tolerance test’s kind of insight: how sharply your sugar spikes after a real glucose load. When the A1C and a fasting glucose disagree, or when the A1C is untrustworthy for one of the reasons covered above, the glucose tests break the tie.
What to actually do about a high A1C
Seeing a number in the prediabetes or diabetes range is unsettling, but the A1C is one of the most responsive markers you have. Because it tracks a rolling average, sustained changes show up on your next test in a way that feels genuinely motivating. Here is where the leverage is.
- Weight and waistline: Even modest weight loss can meaningfully shift an A1C for people carrying extra weight, and it is often the single highest-impact lever in the prediabetes range.
- Movement after meals: A short walk after eating blunts the post-meal glucose spike, and those daily spikes are part of what your average is built from. This is a habit, not a heroic gym session.
- Cutting liquid sugar: Sugary drinks deliver glucose fast and are one of the easiest things to remove without feeling deprived at the dinner table.
- Sleep and stress: Both raise blood sugar through stress hormones, and chronic short sleep is an underrated driver of a creeping A1C.
The point is not to overhaul your life overnight. Because the A1C averages months, consistency beats intensity. A steady, sustainable change held for a full quarter moves the number more than a dramatic two-week effort that fades. Give any change at least three months before you judge it, because that is the earliest a new habit can be fully reflected in the result.

The most common misreadings of an A1C result
A few misunderstandings show up again and again, and each one can lead people to the wrong conclusion.
- Treating it like a glucose reading. An A1C of 6.0 is not a blood sugar of 6.0. The number is a percentage of glycated hemoglobin, not a milligram-per-deciliter glucose value, which is why the eAG conversion exists.
- Assuming a single high result is a diagnosis. Diabetes is generally confirmed on two separate tests, not one flagged value, so a single elevated A1C is a prompt to repeat, not a verdict (NIDDK).
- Thinking a good A1C means no swings. Two people with the same 7 percent can have wildly different daily patterns, one smooth and one lurching between highs and lows that average out. The A1C hides variability.
- Ignoring the trustworthiness question. If you have anemia, a hemoglobin trait, kidney disease, or you are pregnant, a normal-looking A1C can be misleading, and a glucose test may tell a truer story (Cleveland Clinic).
Read against these, your A1C becomes a tool instead of a source of panic. It is a rolling report card, best interpreted in context, confirmed when abnormal, and paired with day-to-day glucose data when the details matter.
What is actually happening inside your blood to create the A1C number
Understanding the biology makes every other fact about the test click into place. Glucose in your bloodstream binds to hemoglobin through a slow, non-enzymatic process called glycation. There is no active step your body takes to do this. It simply happens whenever sugar and hemoglobin share the same space, and the more sugar present over time, the more binding accumulates. Once glucose latches onto a hemoglobin molecule, it stays attached for the remaining life of that red blood cell.
This is the key to the whole test. Because red cells circulate for roughly 120 days before being replaced, and because the glycation is essentially permanent for each cell, your blood at any moment contains a mix of younger cells with little sugar coating and older cells that have been accumulating it for months. The A1C measures the average across that entire population. That is why a single sugary meal cannot move it much, and why a sustained change in your blood sugar takes weeks to fully register. You are, in effect, reading the collective memory of billions of red cells.
It also explains, in one stroke, every situation where the test misleads. Anything that changes how long red cells live changes the average lifespan of that sugar coating. Cut the lifespan short, as hemolysis or blood loss does, and cells are replaced by fresh, low-sugar ones before they can accumulate coating, dragging the A1C artificially low. Extend the picture with iron deficiency, and older cells linger, nudging it high. The number is only ever as reliable as the assumption that your red cells are living a normal three-month life.
How to read a borderline result without spiraling
Borderline numbers, the 5.6 that is almost prediabetes or the 6.4 that is almost diabetes, cause the most worry and the most confusion. A calm way to read them is to remember three things. First, the A1C has real measurement variability, so a value near a cutoff can land on either side on a repeat test, which is exactly why diagnosis relies on confirmation rather than a single result (NIDDK). Second, the direction and speed of change often matter more than the exact value. A stable 5.9 held for years is a different story from a 5.9 that climbed from 5.4 in a single year.
Third, a borderline A1C is an opportunity, not a sentence. The prediabetes band is precisely where lifestyle change has the most room to work, often reversing the trend before it ever reaches diabetes (NIDDK). The most productive response to a borderline number is to book a repeat test at the interval your clinician suggests, make one or two of the sustainable changes described earlier, and then let the next A1C, which reflects the following quarter, tell you whether it is working. That is the test doing its best job: not scaring you, but giving you a clear, movable target.
Frequently asked questions
What is a normal A1C level?
A normal A1C is below 5.7 percent. A result of 5.7 to 6.4 percent indicates prediabetes, and 6.5 percent or higher on two tests is used to diagnose diabetes (Cleveland Clinic). Compare your number to the reference range printed on your own report.
Do I need to fast for an A1C test?
No. Because the A1C reflects your average blood sugar over the past two to three months rather than your level at that moment, you do not need to fast and a recent meal will not change the result (MedlinePlus).
What is the abbreviation for A1C on a blood test?
A1C is short for hemoglobin A1c, often written as HbA1c or HbA1C. You may also see it listed as glycohemoglobin, glycated hemoglobin, or glycosylated hemoglobin, all of which mean the same test (MedlinePlus).
What does eAG mean next to my A1C?
eAG stands for estimated average glucose. It converts your A1C percentage into mg/dL, the units used on home glucose meters, to make your average easier to picture. An A1C below 7 percent corresponds to an eAG under about 154 mg/dL (MedlinePlus).
Can an A1C result be wrong?
Yes. Conditions such as sickle cell anemia, recent transfusion, pregnancy, and kidney failure can make A1C falsely low, while iron or B12 deficiency can make it falsely high, and some hemoglobin variants interfere with the test entirely (Cleveland Clinic). In those cases your clinician may rely on a glucose test instead.
This article is for general educational purposes and is not medical advice. It cannot diagnose or treat you and does not replace your clinician. Always discuss your lab results and any health decisions with a qualified healthcare professional.
Related reading
Vital Signs Today may earn a commission if you buy through links on this page. It does not affect our editorial assessments.