Disclosure: Vital Signs Today may earn a commission if you buy through links on this page, at no extra cost to you. This does not influence our evidence-based assessments. We are not a medical provider; talk to a clinician before acting on test results.
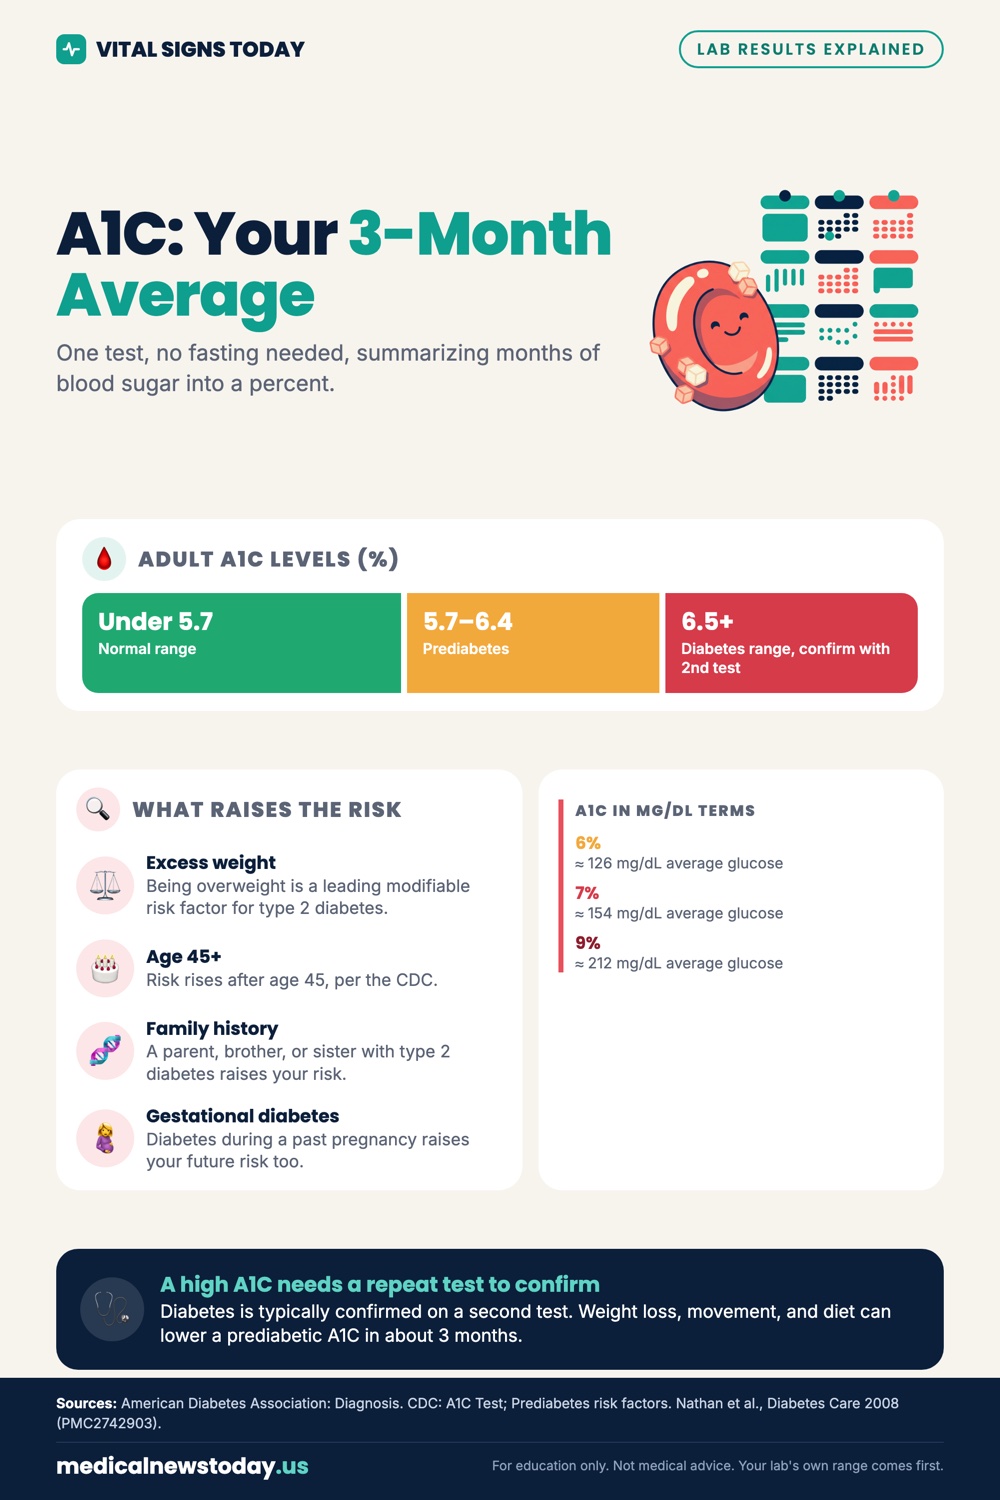
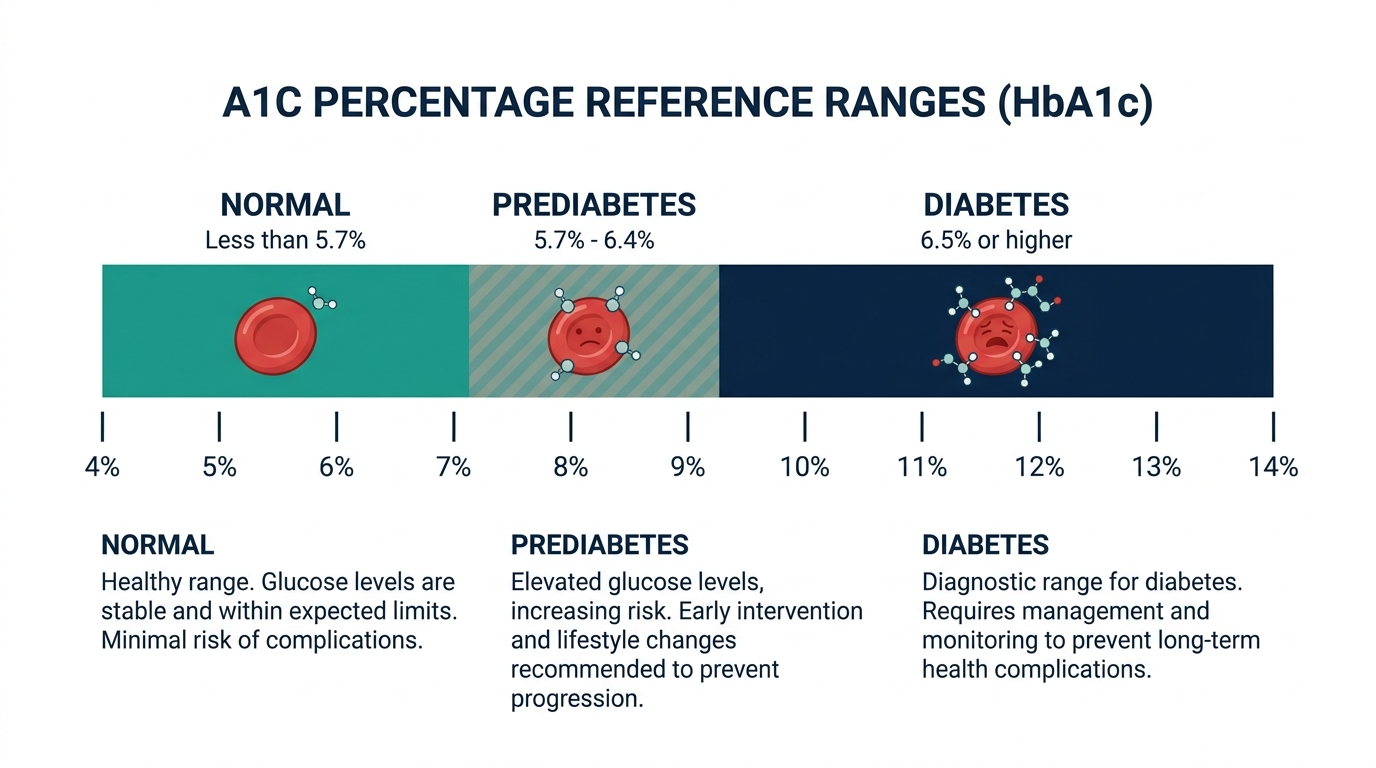
- An A1C blood test measures the average amount of glucose attached to your hemoglobin over the past 2 to 3 months, reported as a percentage, with a normal result being below 5.7 percent.
- An A1C of 5.7 to 6.4 percent signals prediabetes, and an A1C of 6.5 percent or higher on two tests is used to diagnose diabetes, according to the American Diabetes Association.
- An A1C of 7 percent corresponds to an estimated average blood sugar of about 154 mg/dL, but anemia, kidney disease, and hemoglobin variants can make the number unreliable.
If a clinician has ordered an A1C, or you spotted it on a lab report, you are looking at one of the most useful single numbers in metabolic health. It does something a fingerstick glucose reading cannot. It summarizes months of blood sugar into one figure. Below is a plain explanation of what the test is, why it matters, and how to read your result without overreacting to a single decimal point.
What is A1C in a blood test?
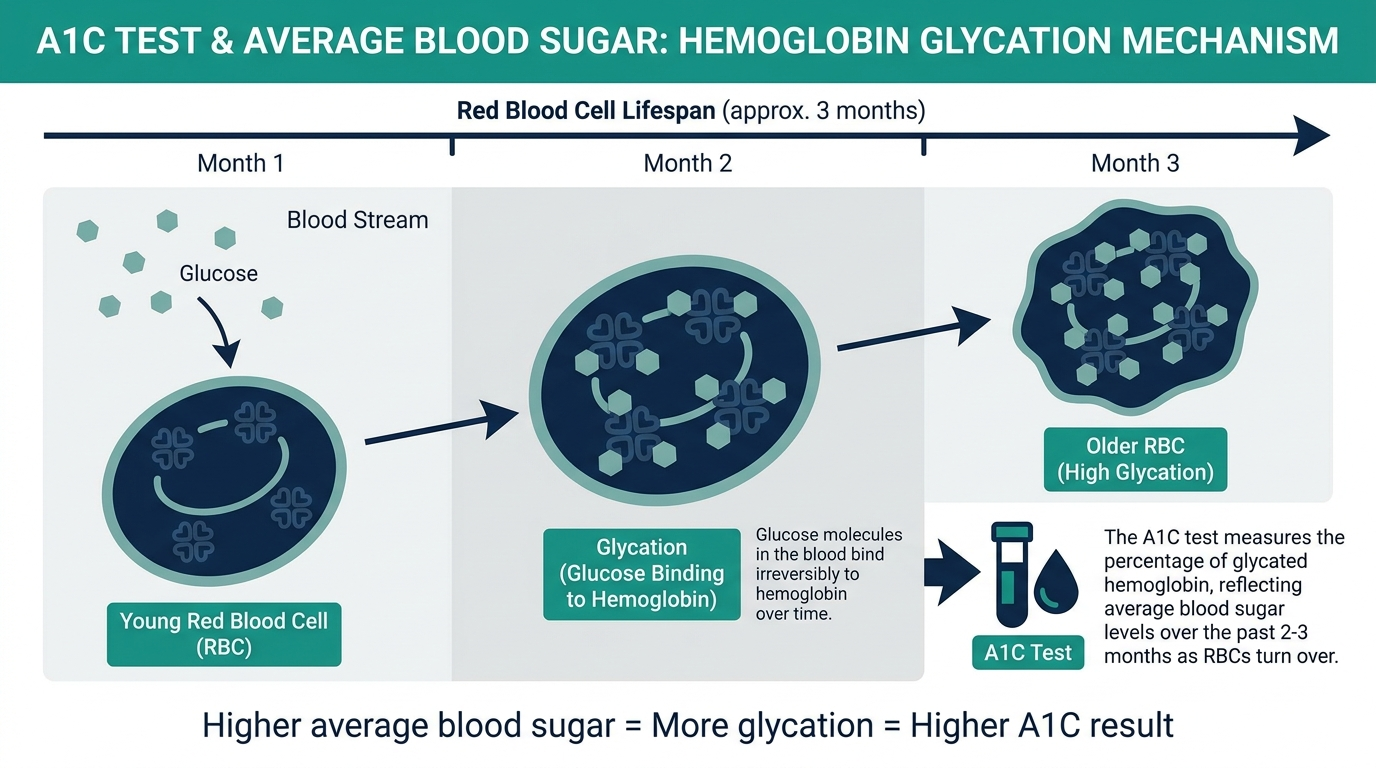
The A1C test, also called hemoglobin A1C or HbA1c, measures the percentage of your hemoglobin that has glucose attached to it, which reflects your average blood sugar over the past 2 to 3 months (MedlinePlus). A normal A1C is below 5.7 percent (American Diabetes Association).
Here is the mechanism in everyday terms. Glucose in your bloodstream naturally sticks to hemoglobin, the protein inside red blood cells that carries oxygen. The more glucose floating around over time, the more of it bonds to hemoglobin. Because red blood cells live for about 2 to 3 months, the test captures a rolling average over that window rather than a single moment (CDC). That is why you do not need to fast for an A1C and why a slice of cake the night before will not skew it.
Why is A1C measured?
A1C is measured to screen for prediabetes and diabetes and to track how well blood sugar is controlled over time, because it reflects months of data rather than one reading (NIDDK). The CDC notes A1C does not require fasting, which makes it convenient for routine screening (CDC).
Two distinct jobs are worth separating:
- Diagnosis: A one-time A1C helps decide whether someone has normal glucose, prediabetes, or diabetes.
- Monitoring: For people already diagnosed, A1C is usually repeated every 3 to 6 months to see whether treatment, diet, and activity are keeping glucose in range.
A single fingerstick tells you the weather right now. A1C tells you the climate. That longer view is what makes it valuable for catching slow, silent drift toward diabetes before symptoms appear.
What does a high A1C mean?
A high A1C means your average blood sugar has been elevated for months. An A1C of 5.7 to 6.4 percent indicates prediabetes, and 6.5 percent or higher indicates diabetes (Cleveland Clinic). Diagnosis of diabetes generally requires the result to be confirmed on a second test (American Diabetes Association).
Translating the percentage into a familiar number helps. Using the standard estimated average glucose equation, an A1C of 7 percent maps to an average blood sugar of roughly 154 mg/dL, and every 1 percent rise in A1C adds about 29 mg/dL to that average (Clinical Diabetes, ADA).
- 5.7 to 6.4 percent: Prediabetes. Within this band, the higher the number, the higher the risk of progressing to diabetes (ADA).
- 6.5 percent and above: The diabetes range.
A high A1C is not a verdict. Prediabetes in particular is often reversible with weight loss, movement, and dietary change.
What does a low A1C mean?
A low A1C, generally below 5.7 percent, usually means your average blood sugar has stayed in a healthy range and is the desired result for most people without diabetes (American Diabetes Association). Most healthy adults sit somewhere in the 4 to 5.6 percent range.
An unexpectedly low A1C, however, is not always good news. Because the test depends on red blood cells living their normal lifespan, anything that shortens that lifespan or replaces those cells can pull the number down artificially. Recent blood loss, hemolytic anemia, a recent transfusion, advanced kidney or liver disease, and treatments that boost red blood cell production can all produce a falsely low A1C (NGSP). In people on diabetes medication, a genuinely low A1C paired with symptoms can also reflect frequent low blood sugar, which carries its own risks. The number should always be read alongside how you actually feel and your glucose readings.
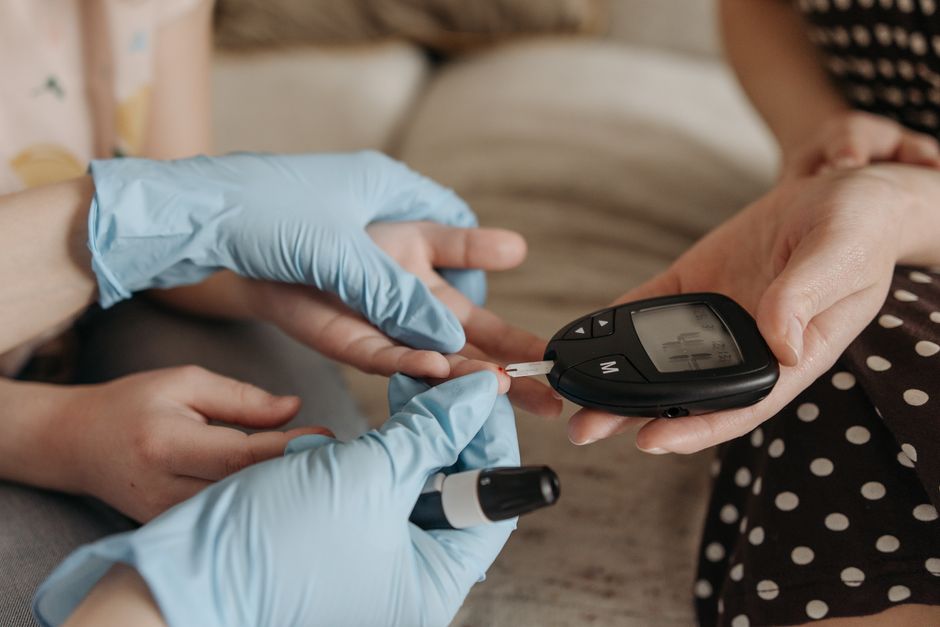
How is A1C interpreted with other markers?
A1C is interpreted alongside fasting plasma glucose, an oral glucose tolerance test, and the estimated average glucose, because these markers cross-check one another and catch cases where A1C alone misleads (NIDDK). When A1C is unreliable, plasma glucose samples are used to confirm a diagnosis (StatPearls, NCBI).
A useful companion number is estimated average glucose, or eAG, which reports your A1C in the same mg/dL units as your home glucose meter. The conversion uses the equation eAG = 28.7 × A1C − 46.7, so an A1C of 6 percent → about 126 mg/dL and 8 percent → about 183 mg/dL (MedlinePlus). When your meter average and your eAG disagree sharply, that mismatch is itself a clue worth investigating.
The insider nuance: why your A1C can lie
The detail many people miss is that A1C is an estimate built on an assumption, namely that your red blood cells live a standard lifespan, and that assumption breaks in common conditions. Hemoglobin variants such as those linked to sickle cell trait or thalassemia, plus anemia and chronic kidney disease, can shift A1C up or down independent of your true glucose (NGSP).
This matters most for people of African, Mediterranean, or Southeast Asian descent, who are more likely to carry a hemoglobin variant that interferes with certain A1C assays (NIDDK). In chronic kidney disease, anemia treatments and transfusions tend to lower A1C while metabolic acidosis can raise it (PMC review). The practical takeaway is simple. If your A1C does not match your symptoms or your glucose log, tell your clinician about anemia, kidney issues, or family history, and ask whether a direct glucose test or fructosamine would give a clearer picture.
A1C to average glucose: the full conversion table
One of the most useful things you can do with an A1C result is translate it into the same mg/dL units your home glucose meter uses. The relationship comes from the A1C-Derived Average Glucose (ADAG) study, which used continuous monitoring and frequent fingersticks across hundreds of people to build the formula every commercial lab now uses: eAG = 28.7 x A1C minus 46.7 (Translating the A1C Assay Into Estimated Average Glucose, PMC). Here is the table at a glance.
| A1C (%) | Estimated average glucose (mg/dL) | Category |
|---|---|---|
| 5.0 | 97 | Normal |
| 5.7 | 117 | Prediabetes begins |
| 6.0 | 126 | Prediabetes |
| 6.5 | 140 | Diabetes begins |
| 7.0 | 154 | Common diabetes target |
| 8.0 | 183 | Above target |
| 9.0 | 212 | Well above target |
| 10.0 | 240 | High |
Want to check your blood sugar?
Three ways to get it measured. Pick whichever fits you.
Affiliate links: we may earn a commission at no extra cost to you. A lab test does not replace a visit with your clinician.
Reading the table this way makes the stakes concrete. Moving from an A1C of 9 percent to 7 percent is not a small cosmetic shift, it is dropping your average blood sugar from roughly 212 mg/dL to 154 mg/dL. When your meter’s own multi-week average and your eAG disagree sharply, that gap is itself a clue that something is interfering with one of the measurements, and it is worth raising with your clinician.

Who should get an A1C test and how often
A1C is used both to find diabetes in people who do not know they have it and to monitor those who do. The screening thresholds are worth knowing so you can judge whether the test applies to you.
Screening is generally recommended for adults with any of these risk factors:
- Overweight or obesity, which is the single biggest modifiable driver of type 2 diabetes risk.
- Age 35 and older, after which routine screening is commonly advised even without other risk factors.
- Family history of diabetes in a parent or sibling.
- Physical inactivity and a diet high in refined carbohydrates and sugary drinks.
- High blood pressure or abnormal cholesterol, which cluster with insulin resistance.
- A history of gestational diabetes or delivering a large baby.
- Polycystic ovary syndrome (PCOS), which is tightly linked to insulin resistance.
- Certain ancestries at higher risk, including African American, Hispanic, Native American, and Asian American populations.
For monitoring, the interval depends on control. People with well-controlled diabetes are often tested about twice a year, while anyone changing treatment or not yet meeting goals may be tested every three months, roughly the lifespan of a red blood cell (NIDDK). Testing more often than every three months rarely adds information, because the marker simply cannot change faster than that.
How to lower a high A1C: what actually moves the number
Because A1C reflects months of glucose, lowering it means lowering your average blood sugar over weeks, not chasing a single reading. In the prediabetes range especially, lifestyle change is often enough to reverse the trend. Here is what genuinely moves the number and why.
- Lose modest weight if you carry excess. Even a small percentage of body weight lost improves insulin sensitivity, meaning your cells pull glucose out of the blood more efficiently.
- Move after meals. Muscle contraction lets cells take up glucose without needing as much insulin, so a walk after eating blunts the post-meal spike that feeds your average.
- Build regular aerobic and resistance activity. Aerobic exercise lowers glucose acutely, and added muscle from resistance training gives your body more places to store glucose long term.
- Cut refined carbohydrates and sugary drinks. These cause the sharpest glucose spikes, and reducing them lowers the peaks that raise your rolling average the most.
- Prioritize fiber and protein. Both slow the rise in blood sugar after a meal, flattening the curve your A1C is averaging.
- Sleep and manage stress. Poor sleep and chronic stress raise cortisol, which pushes glucose up, so both are legitimate levers on your number.
The important expectation to set is timing. Because red blood cells live two to three months, a genuine improvement in your habits shows up in your A1C gradually over about three months, not overnight. If your first re-test after starting changes looks flat, the fuller effect may still be arriving.
A1C compared with other glucose tests
A1C is powerful but not the only way to assess blood sugar, and knowing the alternatives explains when each is used.
- Fasting plasma glucose: a single measurement after not eating for at least 8 hours. It is a snapshot, sensitive to what you did the day before, and useful when A1C may be unreliable.
- Oral glucose tolerance test (OGTT): measures how your blood sugar responds to a fixed glucose drink over two hours. It is the most sensitive for catching early impaired glucose handling and is the standard for diagnosing gestational diabetes.
- Continuous glucose monitoring (CGM): a wearable sensor that tracks glucose in real time, revealing spikes, time in range, and overnight patterns that an average can hide.
- Fructosamine: reflects average glucose over the past two to three weeks rather than months, useful when red blood cell lifespan is abnormal and A1C cannot be trusted.
The reason clinicians keep several tools is that they cross-check each other. When A1C is affected by a hemoglobin variant, anemia, or kidney disease, a fasting glucose or OGTT is used to confirm the picture. A1C’s strength is the long, fasting-free average. Its weakness is that a single averaged number can hide dangerous swings, which is exactly where CGM or fingerstick logs fill the gap.

Why an uncontrolled A1C matters: the long-term stakes
A high A1C is not just a number on a portal, it is a marker of the cumulative glucose exposure that drives diabetes complications. Sustained high average blood sugar damages small and large blood vessels over years, which is why the goal of lowering A1C is ultimately to protect organs, not to hit a target for its own sake.
- Eyes: chronic high glucose can damage the retina’s tiny vessels, a leading cause of vision loss in adults.
- Kidneys: the filtering units are vulnerable to long-term glucose damage, which can progress to chronic kidney disease.
- Nerves: prolonged high glucose can cause numbness, tingling, or pain, most often in the feet.
- Heart and blood vessels: diabetes substantially raises the risk of heart attack and stroke through accelerated damage to larger arteries.
The encouraging counterpart is that these risks track with control. Bringing an elevated A1C down toward target lowers the pace of vessel damage, and in the prediabetes range, acting early can keep you from crossing into diabetes at all. That is the real reason the test exists: it turns years of silent, symptomless glucose exposure into a single number you can act on before damage accumulates.
A1C targets are personal, not one-size-fits-all
A common misconception is that everyone with diabetes should aim for the same A1C. In reality, targets are individualized, and a number that is right for one person can be wrong for another.
- Many adults with diabetes aim below 7 percent, a widely used general target that balances protection against complications with the risk of low blood sugar.
- Younger, healthier people early in the disease may aim for a tighter target if they can reach it safely, because they have more years of glucose exposure ahead to protect against.
- Older adults or those with multiple health conditions may be given a more relaxed target, because the harm from frequent low blood sugar can outweigh the benefit of a very tight number.
- People prone to severe hypoglycemia are often set a higher, safer target, since dangerous lows are an immediate risk while the benefits of very tight control accrue slowly.
The takeaway is to read your A1C against the target your clinician set for you, not against a single universal cutoff you saw online. A result of 7.2 percent might be a success for one person and a prompt to adjust treatment for another. This is also why chasing the lowest possible number is not automatically the goal, because for people on glucose-lowering medication, an aggressively low A1C can reflect frequent, risky lows rather than good control.
Common mistakes when interpreting your A1C
A few recurring errors lead people to misread this test. Avoiding them keeps you from either false alarm or false reassurance.
- Treating one result as a diagnosis. A single A1C in the diabetes range generally needs confirmation on a second test before diabetes is diagnosed, unless you have clear symptoms and very high glucose.
- Expecting overnight change. Because the marker averages months, retesting a few weeks after starting new habits often shows little movement even when you are on the right track. Give it about three months.
- Ignoring interfering conditions. Anemia, recent blood loss or transfusion, kidney disease, and hemoglobin variants can all push A1C up or down independent of your true glucose. If your number does not match how you feel or your glucose log, mention these to your clinician.
- Over-focusing on the decimal. The difference between 5.6 and 5.8 percent is small and can vary with the lab and assay. The trend across several tests matters more than a single tenth of a point.
- Forgetting the average hides swings. Two people with the same A1C can have very different glucose patterns, one steady and one swinging between highs and lows. If you have symptoms of either extreme, the average alone is not the full story.
Read as a trend, confirmed when it matters, and interpreted alongside your symptoms and any interfering conditions, the A1C becomes one of the most actionable numbers in your entire lab report.
Frequently asked questions
Do I need to fast before an A1C test?
No. The A1C reflects a 2 to 3 month average, so eating beforehand does not change the result. You can have it drawn at any time of day, with or without a meal, which is part of why it is convenient for screening (CDC).
What is a good A1C number?
For people without diabetes, a good A1C is below 5.7 percent. Many people with diagnosed diabetes aim for below 7 percent, though individual targets vary by age and health. Your clinician sets the right goal for you (American Diabetes Association).
How often should A1C be tested?
People with well-controlled diabetes are often tested about twice a year, while those changing treatment or not meeting goals may be tested every 3 months. For screening, frequency depends on your risk factors and prior results (NIDDK).
Can A1C go down without medication?
Yes. Weight loss, regular physical activity, and dietary changes can lower A1C, especially in the prediabetes range. Because the test reflects months of glucose, expect changes to show up gradually over about 3 months, not overnight (Cleveland Clinic).
Is A1C the same as blood sugar?
Not exactly. Blood sugar is your glucose level at one moment, while A1C is your average over 2 to 3 months expressed as a percentage. The estimated average glucose, or eAG, converts A1C into mg/dL so you can compare it to meter readings (MedlinePlus).
Sources
- American Diabetes Association, Understanding A1C
- Cleveland Clinic, A1C: What It Is, Test, Levels and Chart
- NIDDK, The A1C Test and Diabetes
- CDC, A1C Test for Diabetes and Prediabetes
- MedlinePlus, Hemoglobin A1C (HbA1c) Test
- MedlinePlus, Estimated Average Glucose (eAG)
- Clinical Diabetes (ADA), Good to Know: Understanding Your A1C Test
- American Diabetes Association, Diabetes Diagnosis and Tests
- StatPearls (NCBI), Hemoglobin A1C
- NGSP, Factors That Interfere with HbA1c Test Results
- PMC, Limitations of Hemoglobin A1c in Type 2 Diabetes
- Cleveland Clinic, Prediabetes
This article is for general educational purposes and is not medical advice. It cannot diagnose or treat you and does not replace your clinician. Always discuss your lab results and any health decisions with a qualified healthcare professional.
Vital Signs Today may earn a commission if you buy through links on this page. It does not affect our editorial assessments.