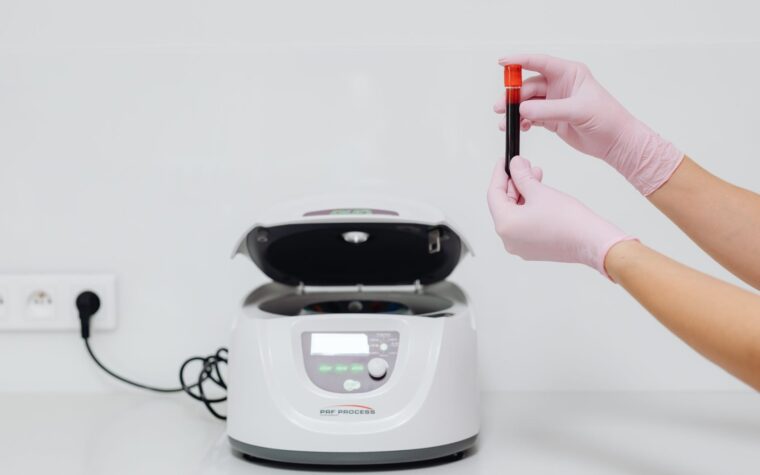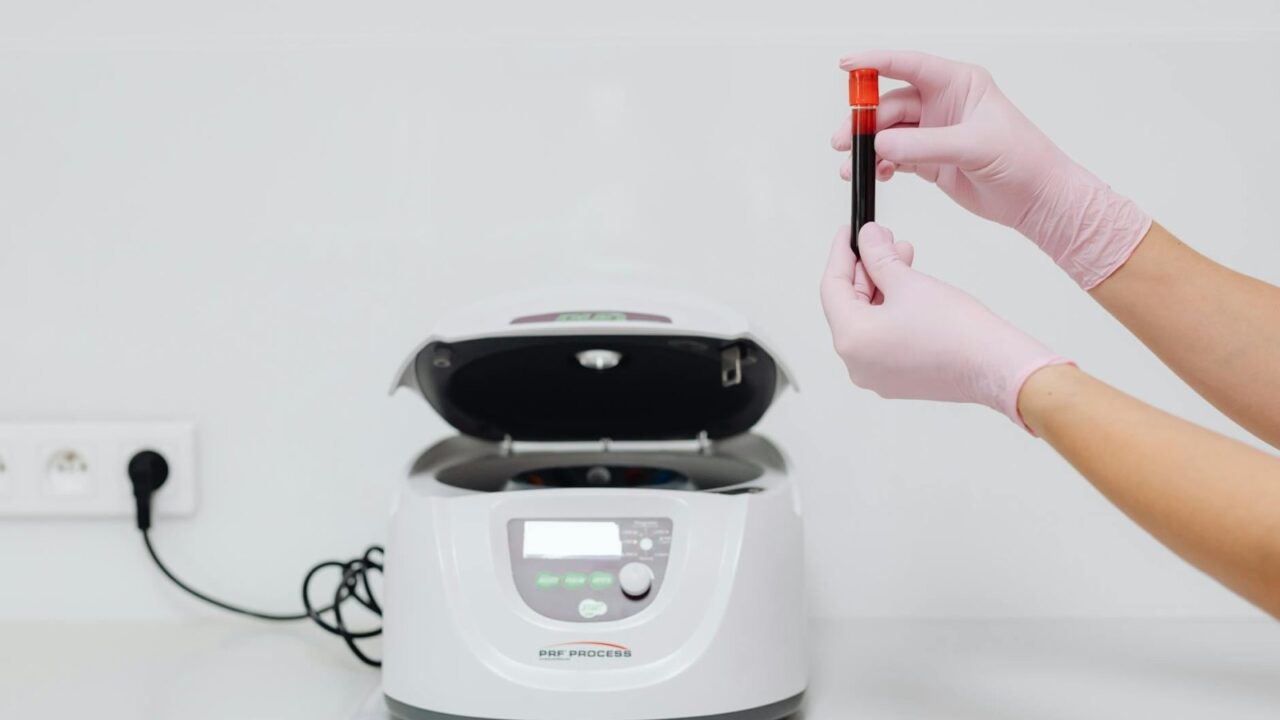
A biomarker is a measurable characteristic in your blood, tissue, or body that signals what is happening biologically, whether that is normal function, the early stages of disease, or how well a treatment is working. The National Institutes of Health and FDA jointly define biomarkers as “defined characteristics measured as indicators of normal biological processes, pathogenic processes, or responses to an exposure or intervention.” That definition sounds dry, but the implication is significant: a well-validated biomarker does not just describe where you are today; it tells you where you are likely to end up.
This article is for informational purposes only and does not constitute medical advice. See our full medical disclaimer.
Key Takeaways
- Biomarkers are validated measurements tied to real biological processes and health outcomes, not just reference-range numbers.
- Standard lipid panels can miss significant cardiovascular risk; ApoB and hs-CRP add predictive power that LDL cholesterol alone does not capture.
- Fasting insulin and HOMA-IR detect insulin resistance years before blood glucose rises above the diabetic threshold.
- HbA1c reflects 90-day average blood sugar and is the most widely used glycemic biomarker for diabetes diagnosis and management.
- DNA methylation clocks can estimate biological age from a blood sample, with stronger associations to health outcomes than chronological age.
- Most high-value biomarkers can be added to a routine blood draw for a modest additional cost; the hard part is finding a clinician who will interpret them properly.
What Is a Biomarker, Exactly?
The simplest way to actually get this done
Superpower is a full-body lab membership that runs 100+ biomarkers, has each result reviewed by a doctor, and tracks your numbers year over year (about $199/year). It is what we point readers to when they would rather get one clean, complete draw than chase single tests one at a time. Here is superpower reviewed in full.
The word gets thrown around loosely in wellness marketing, so it is worth grounding it in the formal definition. The FDA and NIH jointly developed a classification system called BEST (Biomarkers, EndpointS, and other Tools) that identifies eight distinct biomarker categories: susceptibility and risk, diagnostic, monitoring, prognostic, predictive, multicomponent, response, and safety biomarkers. Each category serves a different clinical purpose.
A susceptibility biomarker identifies potential for developing a disease before it appears. A prognostic biomarker indicates likelihood of disease recurrence or progression in someone already diagnosed. A predictive biomarker identifies who is likely to benefit from a specific treatment. When a patient asks their doctor to run a comprehensive panel, they are typically asking for a combination of diagnostic and susceptibility biomarkers, the ones most relevant to preventive medicine.
Biomarkers are not limited to blood. They include histologic findings under a microscope, imaging measurements like coronary artery calcium scores, and even physiological signals like blood pressure and resting heart rate. But blood-based biomarkers remain the most practical for routine monitoring because they are minimally invasive, standardized, and relatively affordable.
Lipid Biomarkers: Why Your Standard Cholesterol Panel Has Blind Spots
The standard lipid panel, a measurement of total cholesterol, LDL-C, HDL-C, and triglycerides, has been the foundation of cardiovascular risk assessment for decades. It is not useless, but it has well-documented limitations that practicing cardiologists have been navigating around for years.
The core problem is that LDL cholesterol measures the amount of lipid cargo inside low-density lipoprotein particles, not the number of particles themselves. Cholesterol-to-triglyceride ratios in individual LDL particles range from roughly 1.8 to 11.5, a variability that makes LDL-C an imprecise proxy for atherogenic burden. Two patients can have the same LDL-C value but very different numbers of circulating particles, and it is the particles that penetrate the arterial wall and drive plaque formation.
This is where apolipoprotein B (ApoB) provides a structural advantage. Every atherogenic lipoprotein particle, including LDL, VLDL, IDL, and Lp(a), carries exactly one ApoB molecule. Measuring plasma ApoB therefore directly counts the total atherogenic particle burden, regardless of how much cholesterol those particles happen to carry. A 2021 analysis of nearly 400,000 individuals found ApoB captured cardiovascular risk more accurately than either LDL-C or non-HDL-C. A 2021 review in Arteriosclerosis, Thrombosis, and Vascular Biology (PMC8540246) also documented that ApoB demonstrates higher sensitivity and specificity than LDL-C for predicting myocardial infarction in both men and women. For a deeper comparison of these two markers and when to insist on ApoB testing, read our article on ApoB vs LDL cholesterol.
The practical implication: patients with metabolic syndrome, elevated triglycerides, or type 2 diabetes are most at risk for LDL-C and ApoB diverging. In those populations, a normal LDL can co-exist with a high ApoB, and the risk is real even if the standard panel looks reassuring.
Small Dense LDL: The Particle Type Your Lab Report Probably Does Not Show
Small, dense LDL particles (sdLDL) deserve a mention even though they are not yet universally tested. These particles are more atherogenic than large, buoyant LDL because they penetrate arterial walls more easily, are more susceptible to oxidation, and linger in circulation longer. Research published in PMC (2022) reports that individuals with predominantly small dense LDL particles have a 3 to 7 times elevated risk of coronary heart disease compared to those with large particles, even when LDL-C levels appear similar. ApoB testing indirectly captures sdLDL burden; particle size testing provides additional granularity for high-risk cases.
Inflammation Biomarkers: Reading the Slow Burn
Chronic low-grade inflammation underlies most of the diseases that kill people in wealthy countries: atherosclerosis, type 2 diabetes, certain cancers, and neurodegenerative conditions. The challenge is that this inflammation is subclinical; patients feel nothing while arterial plaques are quietly growing. Inflammation biomarkers give clinicians a window into that process.
High-sensitivity C-reactive protein (hs-CRP) is the most widely validated inflammatory biomarker for cardiovascular risk. CRP is an acute-phase protein produced by the liver in response to inflammatory signals. The high-sensitivity version of the assay detects low-level systemic inflammation that a standard CRP test misses. The CDC and American Heart Association issued a joint consensus statement in 2003 identifying hs-CRP as the optimal inflammatory biomarker for estimating cardiovascular risk in primary prevention, particularly for intermediate-risk patients where the decision about treatment is uncertain. Subsequent data from the Multi-Ethnic Study of Atherosclerosis (2021, PMC8444216) confirmed that hs-CRP modifies cardiovascular risk from other biomarkers including Lp(a), making it additive rather than redundant. For a focused look at what hs-CRP values mean and how inflammation connects to heart disease, see our article on hs-CRP as an inflammation biomarker.
Interpreting hs-CRP requires caution. The test captures any systemic inflammatory burden, not just cardiovascular-related inflammation. A recent infection, autoimmune flare, smoking, obesity, and even vigorous exercise can all elevate hs-CRP. Values below 1.0 mg/L indicate low cardiovascular risk; 1.0 to 3.0 mg/L indicate intermediate risk; above 3.0 mg/L indicates elevated risk, though the result should be confirmed with a repeat test when no acute illness is present.
Glycemic Biomarkers: Catching Metabolic Trouble Early
Blood sugar derangement develops slowly over years, and most people have no symptoms until it is already advanced. The glycemic biomarkers below can detect problems at different stages, which is precisely why knowing which one to use and when matters.
HbA1c: The 90-Day Average
Glycated hemoglobin, or HbA1c, reflects average blood glucose over the preceding two to three months. Red blood cells live approximately 90 days, and during that lifespan, glucose molecules attach to hemoglobin in proportion to how high blood sugar has been. The CDC uses HbA1c as a primary diagnostic criterion: below 5.7% is considered normal, 5.7 to 6.4% indicates prediabetes, and 6.5% or above on two separate tests meets the diagnostic threshold for type 2 diabetes. HbA1c’s clinical strength is its stability; a single fasting glucose reading can fluctuate based on what someone ate the night before, while HbA1c integrates weeks of glycemic exposure. Its limitation is that it can be misleading in people with hemoglobin variants, iron deficiency anemia, or certain chronic conditions that alter red cell lifespan.
Fasting Insulin and HOMA-IR: Catching Insulin Resistance Before Glucose Rises
Here is what the standard metabolic panel misses: insulin resistance, the root driver of type 2 diabetes and a major cardiovascular risk factor, can be present for years before fasting glucose or HbA1c budges. The pancreas compensates by pumping out more insulin to maintain normal blood sugar. During this compensated phase, glucose looks normal. Insulin does not.
Fasting insulin measurement and the derived HOMA-IR score (calculated from fasting insulin and fasting glucose) detect this compensated insulin resistance directly. A meta-analysis published in BMC Endocrine Disorders (PMC6448479, 2019) involving 26,976 non-diabetic adults found that high HOMA-IR was independently associated with a 34% greater risk of all-cause mortality and a 111% greater risk of cardiovascular mortality compared to the lowest HOMA-IR group. These were people with normal glucose who would have passed a standard metabolic panel without comment. For a clinical breakdown of which insulin resistance biomarkers to request and how to interpret your results, see our guide on insulin resistance early biomarkers.
A 2014 study in BMC Research Notes (PMC4137169) found that comprehensive biomarker testing including insulin resistance markers identified an additional 45% of patients with diabetes risk who had entirely normal glycemic indicators on standard tests. That is a substantial number of people who are told they are fine when they are not.
Organ Function Biomarkers: Your Liver and Kidneys Are Sending Signals
Liver and kidney function biomarkers are among the most commonly ordered in routine panels, and they are genuinely useful for detecting damage, though they have a well-known limitation: they are late markers. By the time ALT or AST is elevated, meaningful hepatocyte injury has already occurred. By the time creatinine rises above the normal range, kidney function has often declined significantly.
Alanine aminotransferase (ALT) and aspartate aminotransferase (AST) are liver enzymes released into the bloodstream when hepatocytes are damaged. ALT is more liver-specific; AST is also found in cardiac muscle, skeletal muscle, and red blood cells. Elevated ALT in the absence of other causes is a reliable signal of hepatic stress, whether from nonalcoholic fatty liver disease (NAFLD), alcohol, viral hepatitis, or medication toxicity.
Creatinine and the derived estimated glomerular filtration rate (eGFR) measure kidney filtration capacity. Creatinine is a muscle waste product cleared by the kidneys; when filtration declines, creatinine accumulates. The eGFR calculation adjusts for age, sex, and body size to produce a standardized estimate of kidney function. An eGFR below 60 mL/min/1.73m2 sustained for three months or longer meets criteria for chronic kidney disease (CKD). Tracking eGFR trends over time is often more informative than a single reading because modest year-over-year decline can indicate progressive disease before any single value crosses a threshold.
Biological Age Biomarkers: Can a Blood Test Tell You How Fast You Are Aging?
Two people can be the same chronological age and have dramatically different biological ages. This gap is increasingly measurable. The most scientifically validated approach uses DNA methylation clocks, algorithms trained on methylation patterns at specific CpG sites in the genome that shift predictably with aging and disease exposure.
Several generations of these clocks have been developed, each with improved predictive power. The GrimAge clock, developed by researchers at the University of California Los Angeles, was trained directly on mortality data rather than age alone, making it a stronger predictor of biological risk. A systematic review published in The Lancet Healthy Longevity (2025) found that biological age measured by DNA methylation clocks correlates significantly with frailty and adverse health outcomes, independently of how old someone is on paper.
A more accessible option is the PhenoAge composite score, which derives biological age from nine clinical biomarkers already present in a standard blood panel: albumin, creatinine, glucose, CRP, lymphocyte percentage, mean cell volume, red cell distribution width, alkaline phosphatase, and white blood cell count. This makes it theoretically calculable from routine lab work, without additional testing. It is not yet a standard clinical offering, but its predictive properties are documented in peer-reviewed research. To explore what these tests look like in practice and what the science actually supports, see our overview of biological age tests.
How to Think About Your Results
Reference ranges are not the same as optimal ranges. Laboratory reference ranges represent where 95% of a supposedly healthy population falls, not where you want to be for long-term health. A fasting glucose of 99 mg/dL is technically within normal limits; it also sits right at the edge of prediabetes. A standard LDL-C of 120 mg/dL looks fine; if ApoB is simultaneously elevated, the risk picture is different.
A few practical principles for interpreting biomarker results:
- Trends matter more than single readings. One mildly elevated ALT might be noise. A consistent year-over-year climb is a signal.
- Context changes everything. An hs-CRP of 4.0 mg/L means something different in someone who just ran a marathon than in a sedentary person with a family history of heart disease.
- Some markers cluster. High triglycerides, low HDL, elevated fasting insulin, and increased waist circumference together describe metabolic syndrome with overlapping biomarker patterns. Seeing one should prompt looking at the others.
- Advanced markers fill gaps the standard panel misses. ApoB, fasting insulin, hs-CRP, and HbA1c together paint a cardiovascular and metabolic risk picture that the basic lipid panel and metabolic panel cannot.
The goal of biomarker testing is not to generate anxiety about marginal numbers. It is to identify risk early enough that lifestyle changes, and when necessary medical intervention, can shift the trajectory. Most of the biomarkers discussed in this guide reflect processes that are meaningfully modifiable through diet, exercise, sleep, and stress management. That is the point.
If you want to track these markers without waiting on an annual physical, a growing number of services let you order a comprehensive draw yourself. Our editors break down the options in our guide to the best at-home biomarker tests, and for the two most talked-about full-body platforms we compare coverage and price head to head in Superpower vs Function Health. Thyroid markers like TSH, free T4, and free T3 are not covered in depth here but follow the same trend-over-time logic; see our roundup of the best at-home thyroid hormone tests if that panel is on your list.
Frequently Asked Questions
What is the difference between a biomarker and a regular blood test?
A regular blood test is simply a measurement; a biomarker is a measurement validated to indicate a biological process, a disease state, or a response to treatment. The distinction matters. A fasting glucose reading is a measurement. When it is interpreted as a signal of insulin resistance or early diabetes risk, it is functioning as a biomarker. The FDA and NIH jointly define biomarkers as “defined characteristics measured as indicators of normal biological processes, pathogenic processes, or responses to an exposure or intervention.” In practice, the term biomarker implies that the test has been studied and calibrated against real health outcomes, not just normal reference ranges.
Is ApoB better than LDL cholesterol for predicting heart disease?
For many patients, yes, particularly those with metabolic syndrome, diabetes, or elevated triglycerides. The reason is structural: each atherogenic lipoprotein particle carries exactly one apolipoprotein B molecule, so an ApoB measurement directly counts the number of particles circulating in your blood. LDL cholesterol measures only the lipid content those particles carry, which varies widely between particles. A 2021 analysis of nearly 400,000 individuals found that ApoB captured cardiovascular risk more accurately than either LDL-C or non-HDL-C. Critically, patients can have a normal LDL result while carrying a high burden of small, dense LDL particles, each counted by ApoB but missed by the standard panel. For a detailed comparison, see our guide on ApoB vs LDL cholesterol.
Can a blood test reveal your biological age?
It can give a strong estimate. DNA methylation clocks measure chemical modifications to DNA at specific sites and have emerged as some of the most robust predictors of how quickly an individual is aging. A systematic review published in The Lancet Healthy Longevity in 2025 found that biological age measured by DNA methylation clocks correlates significantly with frailty and adverse health outcomes, independently of chronological age. Simpler composite approaches, like the PhenoAge clock, derive biological age from nine clinical biomarkers already measured in routine blood panels, including CRP, albumin, creatinine, and glucose. These are not consumer toy scores; they carry real prognostic weight and are increasingly used in longevity research.
How often should healthy adults test their key biomarkers?
There is no single universal answer, but a reasonable baseline for healthy adults under 40 with no known risk factors is annually. That covers a standard metabolic panel, fasting lipids, CBC, and fasting glucose. For anyone with cardiovascular risk factors, prediabetes, a family history of heart disease, or metabolic syndrome, adding ApoB, hs-CRP, fasting insulin, and HbA1c at least once a year is well supported by the literature. Biological age tests, including DNA methylation panels, are not yet standard clinical practice and typically cost several hundred dollars out of pocket. The most important step is reviewing results with a clinician who can interpret them in the context of your full history, not just compare numbers against a printed reference range.
This article is for informational purposes only and does not constitute medical advice. See our full medical disclaimer.
Sources
- Biomarker definitions and their applications (PMC, NIH)
- Glossary – BEST (Biomarkers, EndpointS, and other Tools) Resource – NCBI Bookshelf
- Apolipoprotein B and Cardiovascular Disease: Biomarker and Potential Therapeutic Target (PMC8540246)
- High-sensitivity C-Reactive Protein in Atherosclerotic Cardiovascular Disease (PMC, 2025)
- Comprehensive Biomarker Testing of Glycemia, Insulin Resistance, and Beta Cell Function (PMC4137169)
- Fasting insulin, insulin resistance, and risk of cardiovascular or all-cause mortality in non-diabetic adults: a meta-analysis (PMC6448479)
- Biological age measured by DNA methylation clocks and frailty: a systematic review (The Lancet Healthy Longevity, 2025)
- Role of apolipoprotein B in clinical management of cardiovascular risk: Expert Consensus, National Lipid Association (PMC11734832)
- Small dense LDL: An underestimated driver of atherosclerosis (PMC, 2025)
- Targeting Residual Inflammatory Risk: A Shifting Paradigm for Atherosclerotic Disease (PMC6403155)