Quick answer: To read blood test results, find each marker’s value next to its reference range, which is the normal interval printed beside it. Anything outside that range is usually flagged with an H (high) or L (low). A single flagged number rarely means trouble on its own. What matters is how far off it is, whether it sits in a pattern with related markers, and what your symptoms and history say. Learning how to read blood test results means reading the whole panel, not one scary line.
Most people get handed a printout or a patient-portal screen full of acronyms and numbers, and they fixate on the one value with a red flag next to it. That instinct is backward. Below is exactly how to read blood work test results the way a clinician scans them, line by line, so you know when a number actually matters and when it is just statistical noise. This guide walks through every column on the report, decodes a CBC and a metabolic panel marker by marker, gives you reference-range tables you can hold your own numbers against, and shows you the exact three-question filter clinicians use to decide whether a flag deserves a phone call or a shrug.
One flagged marker on a lab report rarely means trouble alone, so what does your full pattern of results actually say? One at-home Superpower draw checks 100+ biomarkers, physician-reviewed.
What the columns on a blood test report mean
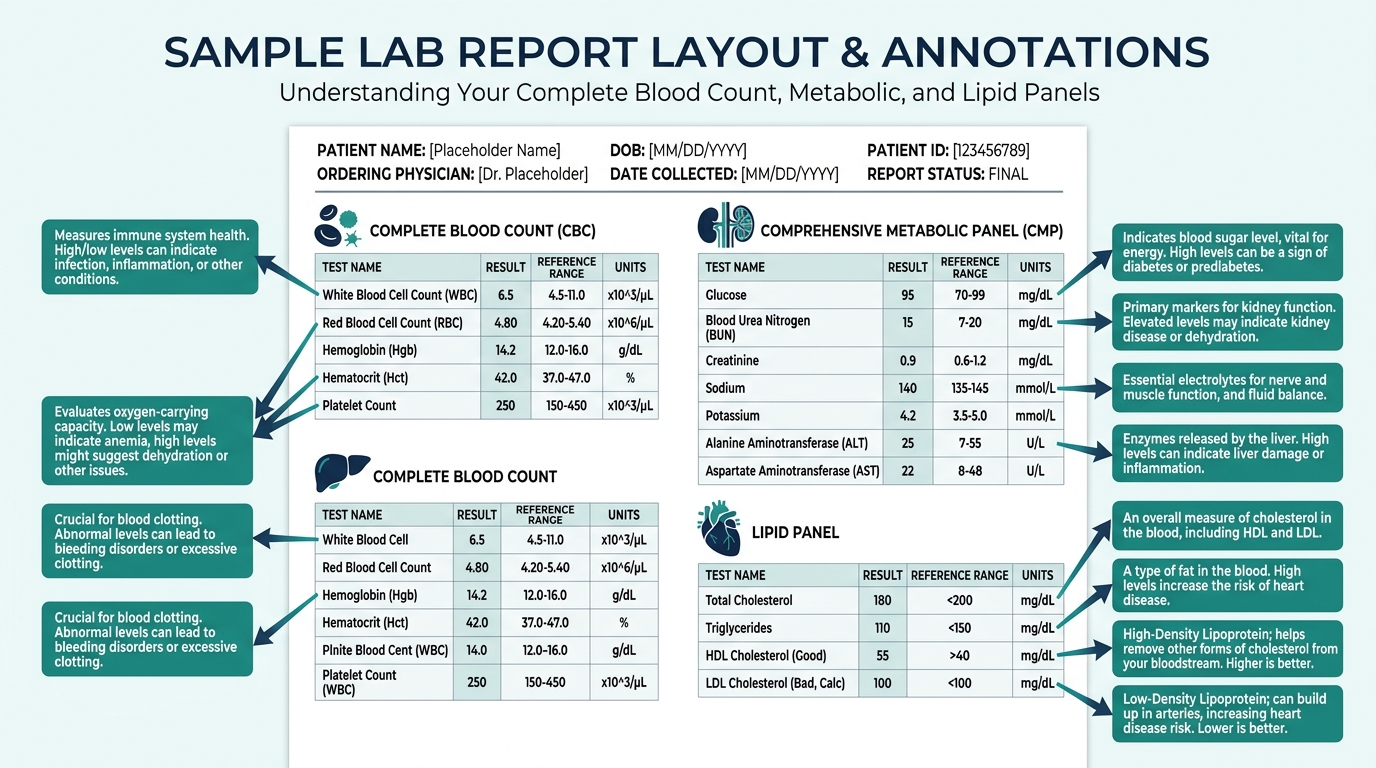
Every result page is built the same way, no matter which lab printed it. Once you know the columns, how to read a blood test stops feeling like a foreign language.
- Test or analyte: the marker being measured, like Hemoglobin or Glucose.
- Result or value: your actual number.
- Units: how it is measured, such as mg/dL or g/dL. A number with no unit is meaningless.
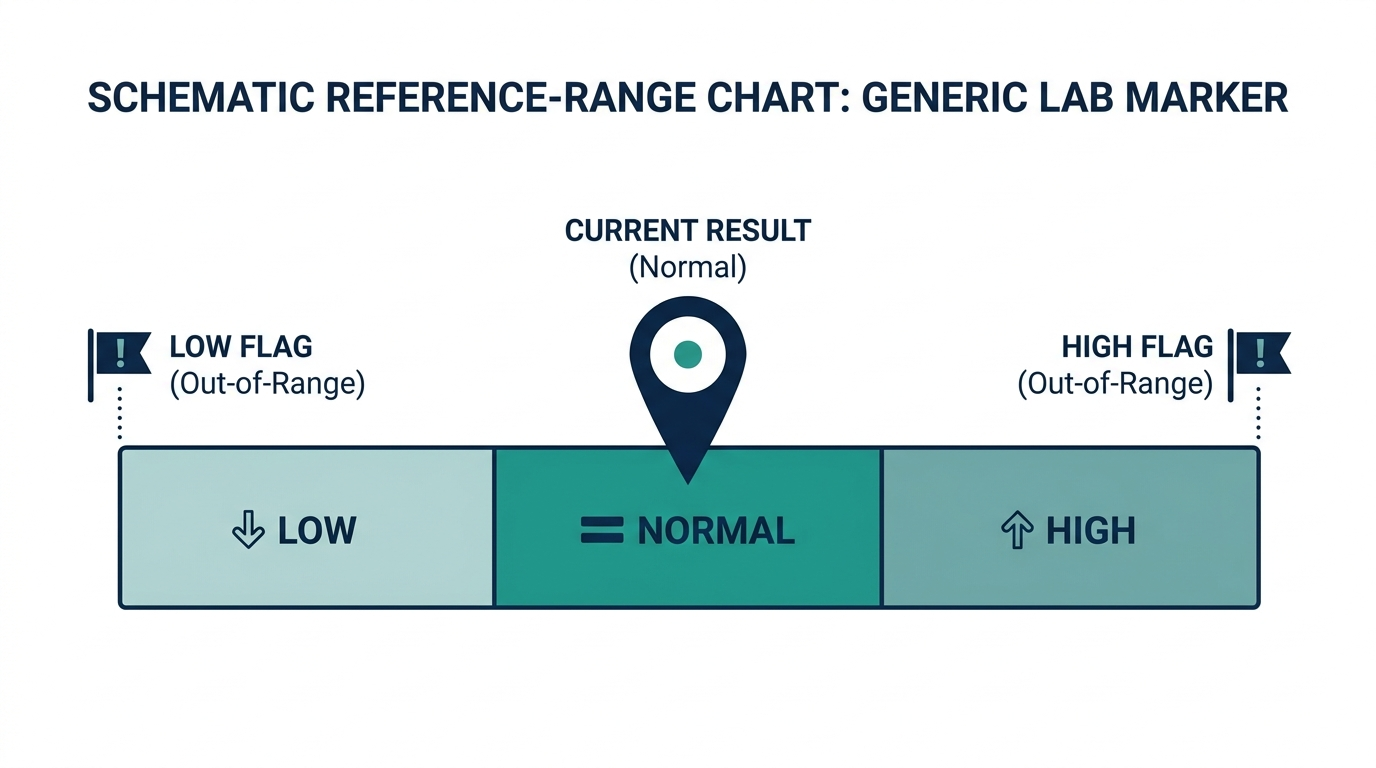
- Reference range: the interval the lab considers normal for most healthy adults.
- Flag: an H, L, or sometimes a star or asterisk when your value falls outside the range.
Here is the insider part most people miss. A reference range is not a line between healthy and sick. It is the middle 95 percent of results from the lab’s reference population, which means 1 in 20 perfectly healthy people land outside it by definition. That is why a clinician does not panic over a value that is barely past the edge. Ranges also differ slightly between labs, so a value that is flagged at Quest may be in range at Labcorp. Always read the range printed on your own report, not one you found online.
Units deserve a second look, because they are where home interpretation goes wrong most often. The same marker can be reported in two unit systems, and the numbers look nothing alike. US labs report glucose in mg/dL, so a normal fasting value reads around 85. Most of the rest of the world uses mmol/L, where the same blood sugar reads about 4.7. If you paste your number into a search bar and compare it against a foreign range, you can scare yourself over nothing or, worse, miss a real problem. Read the unit before you read the number.
What H, L, and other flags actually mean
A flag is a simple yes-or-no signal from the lab’s software: your value fell outside the printed interval. It carries no judgment about severity. An H next to a potassium that is 0.1 above the cutoff looks identical on the page to an H next to a potassium that is genuinely dangerous, yet they mean completely different things. The flag is a flashlight, not a verdict.
- H: above the upper limit of the reference range.
- L: below the lower limit.
- HH or LL (sometimes a star, asterisk, or the word “critical”): a critical or panic value. This is the one tier that genuinely means call now. Labs are legally required to phone critical results to the ordering provider, so if you see this and nobody has contacted you, contact them.
- A or Abn: some systems use “abnormal” instead of H or L, especially for non-numeric results like “positive” or “reactive.”
The trap is treating every H and L as equal. They are not. A panel of 30 markers will throw a flag or two on a healthy person almost every time, purely by the statistics of that 95 percent rule. Reading results well is mostly learning which flags to ignore.

How to read a CBC, line by line
The complete blood count, or CBC, looks at your red cells, white cells, and platelets. To interpret blood test results from a CBC, read it in three blocks instead of one long list. Each block answers a different question: are you anemic, are you fighting something, and can you clot.
Red blood cell markers
Hemoglobin and hematocrit tell you whether you are anemic. Hemoglobin is the protein that carries oxygen, and hematocrit is the percentage of your blood that is red cells, so the two move together. The interesting work is in the red cell indices that sit underneath them, especially MCV, the mean corpuscular volume, which measures red cell size.
Low hemoglobin with low MCV (small red cells) points toward iron deficiency, the most common cause in menstruating women. Low hemoglobin with high MCV (large cells) points more toward a B12 or folate issue. Low hemoglobin with a normal MCV often shows up in chronic disease or recent blood loss. Reading hemoglobin and MCV together is the whole game. One value alone tells you little. RDW, the red cell distribution width, adds a tiebreaker: a high RDW means your red cells vary a lot in size, which leans toward a nutritional deficiency over a chronic-disease pattern.
White blood cell markers
The WBC count rises with infection, stress, and even a hard workout that morning. A mildly high WBC right after you were sick is rarely alarming. The differential underneath it tells you more about what type of response your body is mounting. Neutrophils climb with bacterial infections, lymphocytes with viral ones, and eosinophils with allergies or parasites. So a high WBC that is mostly neutrophils after a fever reads very differently from a high WBC that is mostly eosinophils in someone with new seasonal allergies. The differential is where the WBC count earns its keep.
Platelets
Platelets help you clot. They drift up after inflammation and down with certain medications. A platelet count that is mildly off on one draw is often worth simply repeating in a few weeks rather than chasing immediately. One technical cause of a falsely low platelet count is worth knowing: clumping in the collection tube. If your platelets read low but you have no bruising or bleeding, the lab may flag it for a manual recheck, and the repeat often comes back normal.
How to read a metabolic panel (CMP)
The comprehensive metabolic panel checks your kidneys, liver, blood sugar, and electrolytes. To read lab results for blood work on a CMP, group the 14 markers by the organ they report on instead of reading top to bottom. The print order on the page is alphabetical or instrument-driven, which scrambles related markers apart. Regrouping them is the single most useful habit for reading a CMP.
- Kidney: creatinine, BUN, and eGFR. eGFR is an estimate of kidney filtering. Higher is better here, the opposite of most markers. A normal eGFR sits at 90 or above.
- Liver: ALT, AST, alkaline phosphatase, bilirubin, and total protein. Mild ALT and AST elevations are extremely common and often tied to a fatty liver, recent alcohol, or even intense exercise.
- Blood sugar: glucose. This is the marker most distorted by whether you fasted, which is why timing matters.
- Electrolytes: sodium, potassium, chloride, CO2, and calcium. These are tightly regulated, so even small true shifts can be meaningful.
Two pieces of insider context change how you read a CMP. First, AST is not liver-specific. It also rises from muscle, so a hard leg day or a recent injury can lift AST without anything being wrong with your liver. That is why clinicians weigh the ALT-to-AST ratio rather than either number alone. Second, fasting changes glucose and triglycerides a lot, but it barely touches your A1C, which reflects roughly three months of average blood sugar. So if your fasting glucose looks high but your A1C is normal, the fasting number may have been a blip, maybe from coffee with cream or a poor night’s sleep before the draw. For a fuller picture of how panels fit together, see a complete blood panel and which markers it covers.
How fasting and timing distort your numbers
The same body can produce two very different result sheets depending on the morning of the draw. Knowing which markers are timing-sensitive keeps you from over-reacting to an artifact of when you sat in the chair.
| Marker | Fasting needed? | What throws it off |
|---|---|---|
| Glucose (fasting) | Yes, 8 to 12 hours | Any food or sweet drink, stress, a bad night’s sleep |
| Triglycerides | Yes, 9 to 12 hours | A recent meal can spike them sharply |
| Hemoglobin A1C | No | Almost nothing short-term; it averages 3 months |
| LDL cholesterol | Often, but newer guidance allows non-fasting | Recent fatty meal (LDL is calculated from triglycerides) |
| Potassium | No | A clenched fist during the draw or a clumped sample can falsely raise it |
| AST and ALT | No | Intense exercise in the prior day or two |
This is why repeating an off value is so often the right move rather than panicking. A single high glucose after a restless night, drawn without true fasting, is a weak signal. The same number twice, fasting, with a matching A1C, is a real one.
Common blood test markers and their normal ranges
These are typical US adult reference ranges. Your lab’s printed range is what counts, but this table helps you orient quickly when you are trying to figure out how to read your blood test results at a glance.
| Marker | What it checks | Typical adult range | Units |
|---|---|---|---|
| Hemoglobin | Oxygen-carrying capacity | 13.5 to 17.5 (men), 12.0 to 15.5 (women) | g/dL |
| Hematocrit | Percent of blood that is red cells | 38.3 to 48.6 (men), 35.5 to 44.9 (women) | % |
| White blood cells | Immune activity | 4,500 to 11,000 | cells/mcL |
| Platelets | Clotting | 150,000 to 400,000 | /mcL |
| MCV | Red cell size | 80 to 100 | fL |
| Glucose (fasting) | Blood sugar | 70 to 99 | mg/dL |
| Hemoglobin A1C | 3-month avg blood sugar | Below 5.7 | % |
| Creatinine | Kidney function | 0.7 to 1.3 | mg/dL |
| eGFR | Kidney filtering rate | 90 or above | mL/min/1.73m2 |
| BUN | Kidney and hydration | 7 to 20 | mg/dL |
| ALT | Liver | 7 to 56 | U/L |
| AST | Liver and muscle | 10 to 40 | U/L |
| Potassium | Electrolyte, heart rhythm | 3.5 to 5.1 | mmol/L |
| Sodium | Electrolyte, fluid balance | 135 to 145 | mmol/L |
| Total cholesterol | Cardiac risk | Below 200 | mg/dL |
| LDL cholesterol | “Bad” cholesterol | Below 100 | mg/dL |
| HDL cholesterol | “Good” cholesterol | Above 40 (men), above 50 (women) | mg/dL |
| Triglycerides | Blood fat | Below 150 | mg/dL |
| TSH | Thyroid | 0.4 to 4.0 | mIU/L |
| Vitamin D | Bone and immune | 30 to 100 | ng/mL |
A note on direction, since it trips people up. For most markers, lower is calmer and higher is the flag. But several work the opposite way. eGFR and HDL are both better when higher, so a low HDL or a low eGFR is the concerning direction. Vitamin D is the same: the worry is being too low, not too high. When a marker is flagged L, ask first whether low is even the bad direction for that one.
How to read blood test results when a number is flagged
This is where how to read blood test results gets practical, and three questions sort the noise from the signal. Run every flag through all three before you do anything.
- How far outside the range is it? A value one or two points past the edge is a different conversation than one that is double the upper limit. Magnitude is the first filter, and it eliminates most false alarms on its own.
- Does it fit a pattern? One off marker is noise. Three related liver markers all elevated together is a pattern worth a call. Patterns are how clinicians turn scattered numbers into a story.
- Do you have symptoms? A flagged number with matching symptoms carries far more weight than the same number in someone who feels fine. Numbers without symptoms are usually worth a watchful repeat; numbers with symptoms move up the priority list.
Worked example: a single high glucose
Say your fasting glucose comes back at 104, flagged H, with the range printed as 70 to 99. Run the filter. Magnitude: it is 5 points over, barely past the edge, the kind of miss that happens to 1 in 20 healthy people. Pattern: your A1C on the same report is 5.4, comfortably normal, which tells you your three-month average blood sugar is fine, so the single high reading does not fit a diabetic pattern. Symptoms: none. The honest read is that this is most likely a borderline blip, possibly because you were not fully fasting or slept badly. The sensible response is to recheck it fasting in a few weeks, not to assume diabetes. If the repeat is also high and the A1C climbs, that is a real pattern worth acting on.
Worked example: three liver markers up together
Now say your ALT is 78 (range 7 to 56), AST is 65 (range 10 to 40), and alkaline phosphatase is mildly elevated too. Magnitude: each is moderately over, not double, but not trivial. Pattern: this is the key difference from the glucose case. Three liver markers moving in the same direction is a coherent signal, not random noise. Symptoms: maybe none, maybe some fatigue or right-upper-belly discomfort. Even without symptoms, a pattern across related markers earns a call, because fatty liver, alcohol, certain medications, or a viral cause could be behind it, and the next step is a conversation, not a guess. Pattern beats any single number.
Some shifts deserve a same-week call regardless of the filter: a very high potassium, a glucose well into the diabetic range, or a sharp drop in hemoglobin. When you are unsure, talk to a clinician about your results rather than self-diagnosing from a chart. If you also want to know how soon to expect these numbers, see How Long Do Test Results Take? Turnaround by Test Type. And if you are deciding what to monitor over time, the biomarkers worth tracking is a useful starting list.

Common mistakes people make reading their own results
The errors below are the ones that send healthy people into a spiral or, occasionally, let a real problem slide. Knowing them is half of reading results well.
- Fixating on the one red flag. The flagged line draws the eye, but on a 30-marker panel a stray flag is expected. Read the whole sheet before you decide the flag means anything.
- Comparing your number to an online range instead of the printed one. Lab ranges differ, and the internet is full of ranges in foreign units. The only range that applies to your value is the one printed beside it on your report.
- Ignoring units. Glucose of 5 sounds terrifying in mg/dL and is perfectly normal in mmol/L. Always confirm the unit system before you react.
- Assuming any flag means “sick.” A flag means “outside the interval,” not “abnormal in a meaningful way.” Severity is about how far off, not whether the flag exists.
- Reading a single draw as destiny. Blood values fluctuate by the day, the meal, and even the workout. A trend over time beats any one snapshot, which is exactly why labs that track you year over year are more useful than a one-off.
- Forgetting to mention recent context. If you ran a marathon, started a new supplement, or were sick last week, that context can explain a flag. Bring it up, because your clinician cannot read it off the page.
Edge cases: children, pregnancy, athletes, and the elderly
Standard adult ranges quietly assume a healthy, non-pregnant adult of average build. Step outside that and the ranges shift, sometimes a lot.
- Children: reference ranges are age-specific and change as kids grow. Alkaline phosphatase, for instance, runs much higher in growing children because their bones are actively building, so a value that would be a flag in an adult is normal in a 10-year-old. Pediatric results must be read against pediatric ranges.
- Pregnancy: blood volume expands, which dilutes hemoglobin and makes a mild anemia look normal for pregnancy. Other markers like alkaline phosphatase rise because the placenta produces it. Pregnancy-specific ranges exist for a reason.
- Athletes: endurance athletes often run a slightly low hematocrit (dilutional, from expanded plasma volume) and can show elevated AST and creatine kinase from muscle turnover after hard training. A flagged liver-ish or muscle marker the day after a long run is frequently exercise, not disease.
- Older adults: kidney filtering naturally declines with age, so a creatinine and eGFR that would concern you in a 30-year-old can be expected in an 80-year-old. Many ranges are not age-adjusted, so the raw flag overstates the problem.
The through-line: a flag is only meaningful against the right reference population. When the person does not match the assumed population, read the flag with a grain of salt and ask whether an age- or condition-specific range applies.

Reading results in a patient portal versus a paper printout
Most results now land in a portal like MyChart before any human calls you, and the portal has one feature a paper printout cannot match: trending. The same value, units, range, and flag columns appear, but tapping a marker usually pulls up its history as a graph. That history is the single most useful view on the screen, because your own baseline tells you far more than a population range. A creatinine of 1.2 means one thing if you have always been 1.2 and quite another if you were 0.9 last year and 1.0 the year before.
Two portal habits pay off. First, when a result posts before your clinician has reviewed it, resist the urge to interpret a lone flag in isolation, especially late at night. The release is automatic; the interpretation is not. Second, use the same lab for tracking whenever you can, so the trend line is apples to apples. Switching labs mid-track introduces small calibration differences that can look like a real change when nothing moved.
The simplest way to actually get this done
Superpower is a full-body lab membership that runs 100+ biomarkers, has each result reviewed by a doctor, and tracks your numbers year over year (about $199/year). It is what we point readers to when they would rather get one clean, complete draw than chase single tests one at a time. Here is superpower reviewed in full.
Who should do what: a quick decision guide
How aggressively you act on results depends on who you are and what you found. A rough guide, not a rule:
- You feel fine and have one mild, isolated flag: note it, repeat it at your next routine draw, and bring it up at your annual visit. No emergency.
- You have a pattern of related flags, or one value far past the edge: message your clinician through the portal this week. You do not need urgent care, but you do need eyes on it.
- You see a critical or panic flag (HH, LL, or the word critical), or a flag plus real symptoms: call your clinician promptly, or seek urgent care if symptoms are severe. The lab should have already flagged this to your provider.
- You want a real baseline rather than scattered one-off tests: get a broad panel drawn at once and track it over time, so future flags can be read against your own history instead of a population average.
The single biggest upgrade most people can make is moving from reactive single tests to a tracked baseline. A flag means far more when you can see where the line was a year ago.
Curious what your own levels look like?
Baseline 100+ biomarkers today and retest as life changes, all in one membership with physician review.
FAQ
How can I read my blood test results without a doctor?
Start by matching each value to its reference range and noting any H or L flags. Group markers by what they measure (red cells, liver, kidney, blood sugar) and look for patterns rather than single outliers. This gets you oriented, but a clinician should confirm anything meaningfully out of range.
How do you read blood test results that are flagged high or low?
A flag only means the value sat outside the lab’s normal interval, not that something is wrong. Ask how far off it is, whether related markers move with it, and whether you have symptoms. Mild, isolated flags are frequently repeated rather than acted on.
What does H and L mean on a blood test?
H means the value is above the upper limit of the reference range, and L means it is below the lower limit. Neither is a diagnosis. A double letter (HH or LL) or the word “critical” is the one tier that signals a panic value, which labs are required to phone to your provider right away.
How do I read my blood lab results in a patient portal?
Portals usually show the same columns as a printout: value, units, range, and a flag. Many also trend each marker over time, which is the most useful view, since your own baseline often tells you more than a population range. Tap a marker to see its history.
How to read lab results when two labs give different ranges?
Different labs calibrate their instruments and reference populations slightly differently, so a value flagged at one lab can be in range at another. Always read the range printed on the same report as the value, and try to use the same lab for tracking so your trend stays consistent. If you want costs and details, see how much Superpower costs and what Superpower tests for.
Why is my result flagged if I feel completely fine?
Reference ranges capture the middle 95 percent of healthy people, so by design 1 in 20 healthy results land outside the range. On a panel with 20 or 30 markers, a stray flag is statistically expected. That is exactly why an isolated flag in someone with no symptoms is usually repeated rather than treated.
Do I need to fast before a blood test?
It depends on the markers. Glucose and triglycerides are meaningfully altered by recent food, so they call for an 8 to 12 hour fast. A1C, on the other hand, reflects three months of average blood sugar and is not affected by your last meal. If your panel includes glucose, triglycerides, or a calculated LDL, fasting gives the cleanest read.
Which blood test results are considered critical or dangerous?
Critical values are extreme results a lab is required to report immediately, such as a very high potassium, a dangerously low or high glucose, or a sharp drop in hemoglobin. These usually appear with a double-letter flag or the word “critical.” If you see one and no one has contacted you, call your clinician promptly rather than waiting for a routine review.
How accurate is one blood test result?
A single draw is a snapshot that swings with the day, the meal, hydration, and recent exercise. That is why clinicians repeat borderline values and weigh trends over time more than any one number. A result confirmed on a second draw, fasting and in context, is far more reliable than a lone reading.
Vital Signs Today may earn a commission if you buy through links on this page. It does not affect our editorial assessments.